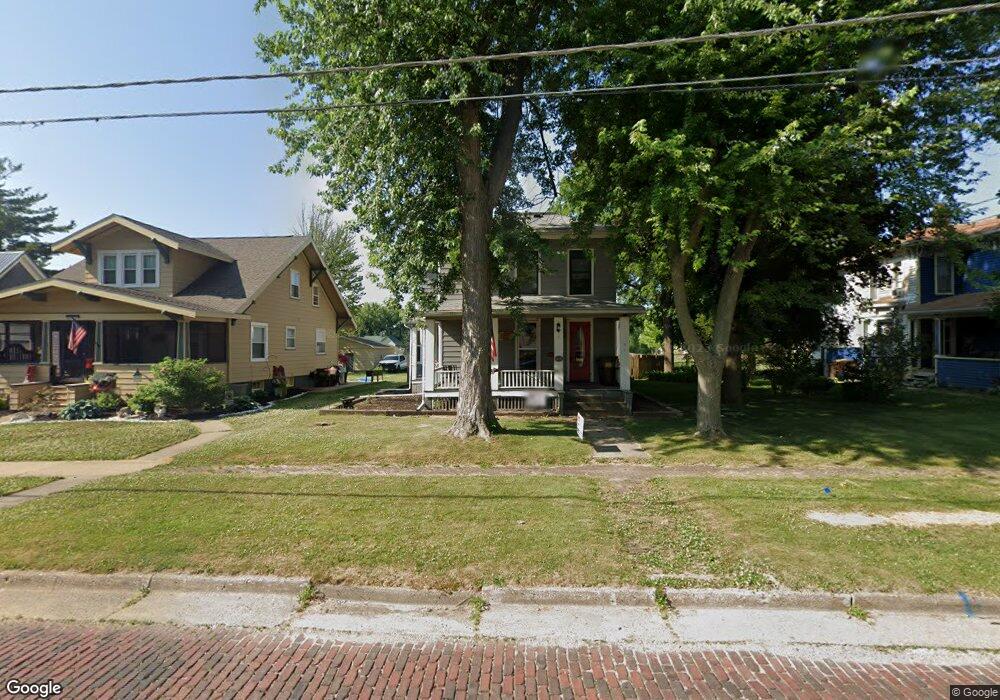
527 E Main St Morrison, IL 61270
Estimated Value: $93,000 - $125,486
4
Beds
2
Baths
2,172
Sq Ft
$51/Sq Ft
Est. Value
About This Home
This home is located at 527 E Main St, Morrison, IL 61270 and is currently estimated at $110,122, approximately $50 per square foot. 527 E Main St is a home located in Whiteside County with nearby schools including Northside School, Southside School, and Morrison Junior High School.
Ownership History
Date
Name
Owned For
Owner Type
Purchase Details
Closed on
Sep 29, 2015
Sold by
Henson Mark L
Bought by
Callan Ryan
Current Estimated Value
Home Financials for this Owner
Home Financials are based on the most recent Mortgage that was taken out on this home.
Original Mortgage
$57,142
Outstanding Balance
$45,882
Interest Rate
4.5%
Mortgage Type
New Conventional
Estimated Equity
$64,240
Purchase Details
Closed on
Feb 19, 2011
Sold by
Perkins Susan L and Yohn Gregory C
Bought by
Yohn Denesse A
Home Financials for this Owner
Home Financials are based on the most recent Mortgage that was taken out on this home.
Original Mortgage
$44,800
Interest Rate
4.85%
Mortgage Type
Purchase Money Mortgage
Create a Home Valuation Report for This Property
The Home Valuation Report is an in-depth analysis detailing your home's value as well as a comparison with similar homes in the area
Home Values in the Area
Average Home Value in this Area
Purchase History
| Date | Buyer | Sale Price | Title Company |
|---|---|---|---|
| Callan Ryan | $56,000 | Attorney | |
| Yohn Denesse A | $56,000 | None Available |
Source: Public Records
Mortgage History
| Date | Status | Borrower | Loan Amount |
|---|---|---|---|
| Open | Callan Ryan | $57,142 | |
| Previous Owner | Yohn Denesse A | $44,800 |
Source: Public Records
Tax History
| Year | Tax Paid | Tax Assessment Tax Assessment Total Assessment is a certain percentage of the fair market value that is determined by local assessors to be the total taxable value of land and additions on the property. | Land | Improvement |
|---|---|---|---|---|
| 2024 | $1,677 | $26,553 | $2,261 | $24,292 |
| 2023 | $1,518 | $24,174 | $2,058 | $22,116 |
| 2022 | $1,390 | $22,450 | $1,911 | $20,539 |
| 2021 | $1,343 | $21,984 | $1,871 | $20,113 |
| 2020 | $1,378 | $22,400 | $1,906 | $20,494 |
| 2019 | $1,126 | $19,269 | $3,155 | $16,114 |
| 2018 | $1,167 | $19,183 | $3,141 | $16,042 |
| 2017 | $1,064 | $18,427 | $3,017 | $15,410 |
| 2016 | $1,003 | $17,773 | $2,910 | $14,863 |
| 2015 | $1,589 | $18,207 | $2,982 | $15,225 |
| 2014 | $1,578 | $18,001 | $2,948 | $15,053 |
| 2013 | $1,589 | $18,207 | $2,982 | $15,225 |
Source: Public Records
Map
Nearby Homes
- 101 N Jackson St
- 102 S Jackson St
- 400 E Knox St
- 403 E Park St
- 00 N Jackson St
- 304 S Madison St
- 302 E Park St
- 503 Portland Ave
- 523 Barden St
- 602 Glenwood Dr
- 208 Johnson St
- 105 E Knox St
- 109 E Morris St
- 518 Barden St
- 308 S Genesee St
- 516 Christopher St
- 406 S Genesee St
- 805 Keith Dr
- 402 W Lincolnway
- TBD Hilltop Dr