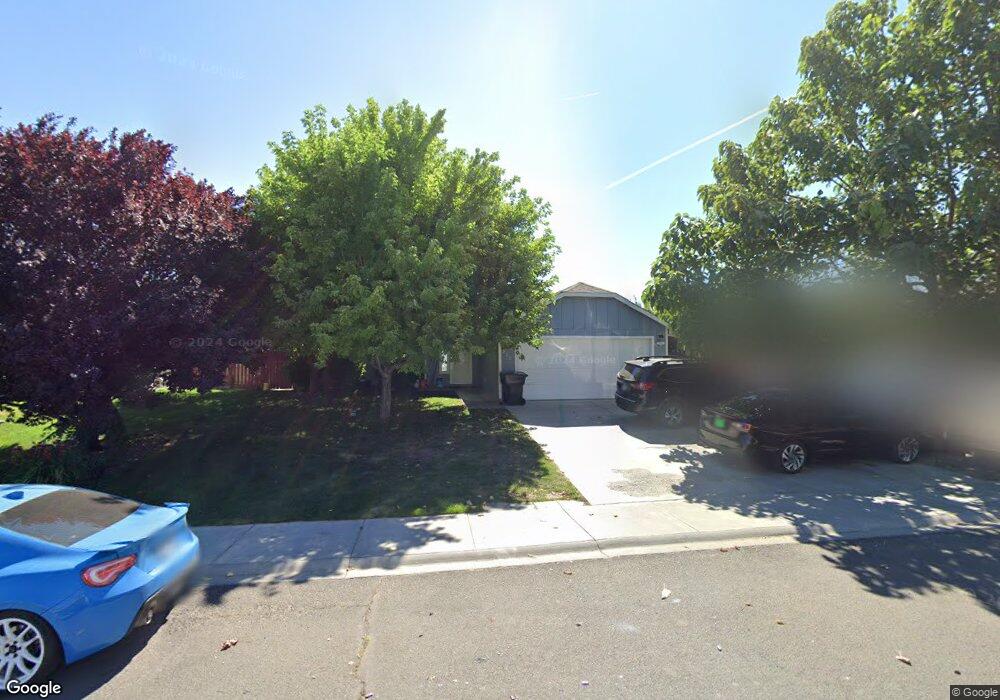
527 Juniper Dr Boardman, OR 97818
Boardman NeighborhoodEstimated Value: $292,261 - $293,000
3
Beds
2
Baths
1,232
Sq Ft
$238/Sq Ft
Est. Value
About This Home
This home is located at 527 Juniper Dr, Boardman, OR 97818 and is currently estimated at $292,631, approximately $237 per square foot. 527 Juniper Dr is a home located in Morrow County with nearby schools including Sam Boardman Elementary School, Windy River Elementary School, and Riverside Junior/Senior High School.
Ownership History
Date
Name
Owned For
Owner Type
Purchase Details
Closed on
Jun 16, 2025
Sold by
Solorzano Maria Guadalupe Medel and Solorzano-Ortiz Maria Guadalupe
Bought by
So Demedel Ma Guadalupe
Current Estimated Value
Home Financials for this Owner
Home Financials are based on the most recent Mortgage that was taken out on this home.
Original Mortgage
$155,000
Outstanding Balance
$154,052
Interest Rate
6.76%
Mortgage Type
New Conventional
Estimated Equity
$138,579
Purchase Details
Closed on
Oct 20, 2023
Sold by
Neal Ryan Dee
Bought by
Neal Gary D and Pizano Stephanie M
Purchase Details
Closed on
Nov 16, 2006
Sold by
Hayden Enterprises Inc
Bought by
Medel Gerardo L
Home Financials for this Owner
Home Financials are based on the most recent Mortgage that was taken out on this home.
Original Mortgage
$109,300
Interest Rate
6.37%
Mortgage Type
New Conventional
Create a Home Valuation Report for This Property
The Home Valuation Report is an in-depth analysis detailing your home's value as well as a comparison with similar homes in the area
Home Values in the Area
Average Home Value in this Area
Purchase History
| Date | Buyer | Sale Price | Title Company |
|---|---|---|---|
| So Demedel Ma Guadalupe | -- | Amerititle | |
| Neal Gary D | $438,750 | First American Title | |
| Medel Gerardo L | $109,355 | -- |
Source: Public Records
Mortgage History
| Date | Status | Borrower | Loan Amount |
|---|---|---|---|
| Open | So Demedel Ma Guadalupe | $155,000 | |
| Previous Owner | Medel Gerardo L | $109,300 |
Source: Public Records
Tax History
| Year | Tax Paid | Tax Assessment Tax Assessment Total Assessment is a certain percentage of the fair market value that is determined by local assessors to be the total taxable value of land and additions on the property. | Land | Improvement |
|---|---|---|---|---|
| 2025 | $2,929 | $134,260 | -- | -- |
| 2024 | $2,482 | $130,350 | -- | -- |
| 2023 | $2,474 | $126,560 | $0 | $0 |
| 2022 | $2,160 | $122,880 | $0 | $0 |
| 2021 | $2,303 | $119,310 | $0 | $0 |
| 2020 | $2,246 | $119,310 | $0 | $0 |
| 2019 | $2,164 | $115,840 | $0 | $0 |
| 2018 | $2,153 | $109,200 | $0 | $0 |
| 2017 | $2,089 | $106,020 | $0 | $0 |
| 2016 | $2,056 | $102,940 | $0 | $0 |
| 2015 | $2,139 | $99,950 | $0 | $0 |
| 2013 | $1,871 | $94,220 | $0 | $0 |
Source: Public Records
Map
Nearby Homes
- 528 Juniper Dr
- 316 Sage St
- 314 Sage St
- 149 Eagle Dr SW
- 153 Eagle Dr SW
- 145 Eagle Dr SW
- 0 Tbd Sw Chickadee Dr Unit 77
- 0 Tbd Sw Chickadee Dr Unit 798278116
- 307 Sage St
- 144 Eagle Dr SW
- 219 SW Sparrow St
- 303 Sage St
- 215 SW Sparrow St
- 224 Rome St
- 00000 Wilson Ln
- 208 Tiber St
- 204 Tiber St
- 200 Tiber St
- 108 Tiber Ct
- 805 SW Mt Adams Ave
Your Personal Tour Guide
Ask me questions while you tour the home.