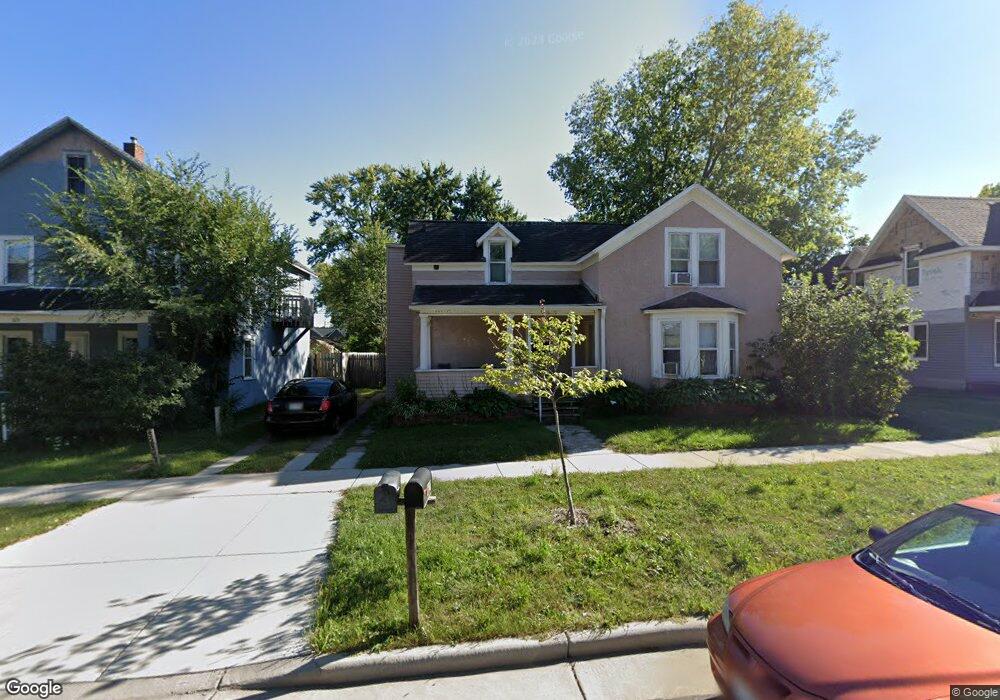
527 Maple St Eau Claire, WI 54703
West Riverside NeighborhoodEstimated Value: $157,000 - $196,000
3
Beds
2
Baths
1,270
Sq Ft
$135/Sq Ft
Est. Value
About This Home
This home is located at 527 Maple St, Eau Claire, WI 54703 and is currently estimated at $171,022, approximately $134 per square foot. 527 Maple St is a home located in Eau Claire County with nearby schools including Lakeshore Elementary School, Delong Middle School, and North High School.
Ownership History
Date
Name
Owned For
Owner Type
Purchase Details
Closed on
May 22, 2024
Sold by
Owens Daniel L
Bought by
Badillo Nestor
Current Estimated Value
Home Financials for this Owner
Home Financials are based on the most recent Mortgage that was taken out on this home.
Original Mortgage
$136,000
Outstanding Balance
$110,602
Interest Rate
6.5%
Mortgage Type
Land Contract Argmt. Of Sale
Estimated Equity
$60,420
Purchase Details
Closed on
Nov 13, 2009
Sold by
Majeski Properties Llc
Bought by
Owens Daniel L
Home Financials for this Owner
Home Financials are based on the most recent Mortgage that was taken out on this home.
Original Mortgage
$40,000
Interest Rate
4.96%
Mortgage Type
Future Advance Clause Open End Mortgage
Purchase Details
Closed on
Apr 10, 2009
Sold by
Associated Bank
Bought by
Majeski Properties Llc
Purchase Details
Closed on
Mar 21, 2008
Sold by
Berry Dennis S
Bought by
First Federal Capital Bank
Create a Home Valuation Report for This Property
The Home Valuation Report is an in-depth analysis detailing your home's value as well as a comparison with similar homes in the area
Home Values in the Area
Average Home Value in this Area
Purchase History
| Date | Buyer | Sale Price | Title Company |
|---|---|---|---|
| Badillo Nestor | $151,000 | -- | |
| Owens Daniel L | $31,000 | None Available | |
| Majeski Properties Llc | $16,100 | American Title & Abstract | |
| First Federal Capital Bank | -- | None Available |
Source: Public Records
Mortgage History
| Date | Status | Borrower | Loan Amount |
|---|---|---|---|
| Open | Badillo Nestor | $136,000 | |
| Closed | Owens Daniel L | $40,000 |
Source: Public Records
Tax History
| Year | Tax Paid | Tax Assessment Tax Assessment Total Assessment is a certain percentage of the fair market value that is determined by local assessors to be the total taxable value of land and additions on the property. | Land | Improvement |
|---|---|---|---|---|
| 2024 | $1,952 | $100,600 | $18,400 | $82,200 |
| 2023 | $1,787 | $100,600 | $18,400 | $82,200 |
| 2022 | $1,738 | $100,600 | $18,400 | $82,200 |
| 2021 | $1,706 | $100,600 | $18,400 | $82,200 |
| 2020 | $1,298 | $67,500 | $14,500 | $53,000 |
| 2019 | $1,300 | $67,500 | $14,500 | $53,000 |
| 2018 | $1,273 | $67,500 | $14,500 | $53,000 |
| 2017 | $1,184 | $54,500 | $14,000 | $40,500 |
| 2016 | $1,190 | $54,500 | $14,000 | $40,500 |
| 2014 | -- | $54,500 | $14,000 | $40,500 |
| 2013 | -- | $53,400 | $14,000 | $39,400 |
Source: Public Records
Map
Nearby Homes
- 538 Maple St
- 2123 8th St
- 2022 8th St
- 520 Fountain St
- 2024 1st St
- 2341 2nd St
- 924 James St
- 733 Gilbert St
- 738 Gilbert St
- 1722 11th St
- 2736 3rd St Unit 1&2
- 324 Mead St
- 1424 Mappa St Unit 2
- 2314 14th St
- 1409 Platt St
- 2908 6th St
- 530 Hobart St
- 1206 1st Ave Unit 1 & 2
- 2858 11th St
- 614 N Barstow St Unit 2
Your Personal Tour Guide
Ask me questions while you tour the home.