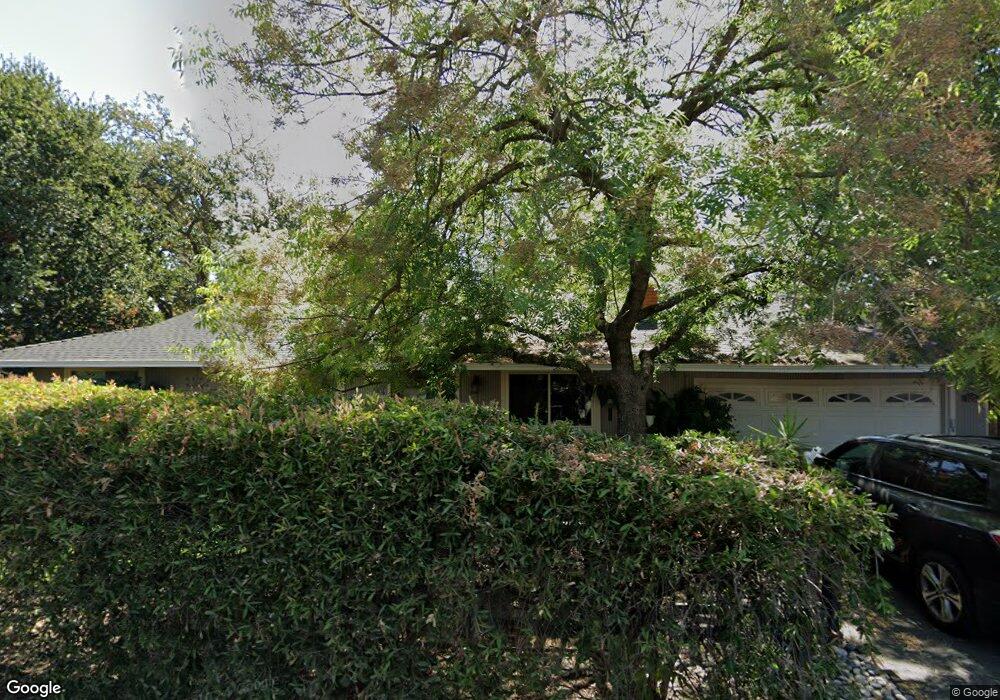
527 Osborn Ln Pleasant Hill, CA 94523
Estimated Value: $943,000 - $1,125,835
3
Beds
2
Baths
1,008
Sq Ft
$1,048/Sq Ft
Est. Value
About This Home
This home is located at 527 Osborn Ln, Pleasant Hill, CA 94523 and is currently estimated at $1,056,709, approximately $1,048 per square foot. 527 Osborn Ln is a home located in Contra Costa County with nearby schools including Strandwood Elementary School, Pleasant Hill Middle School, and College Park High School.
Ownership History
Date
Name
Owned For
Owner Type
Purchase Details
Closed on
Aug 30, 2024
Sold by
Palmer Roy D and Palmer Laura L
Bought by
Palmer Trust and Palmer
Current Estimated Value
Purchase Details
Closed on
May 25, 2016
Sold by
Palmer Roy D and Palmer Laura L
Bought by
Palmer Roy D and Palmer Laura L
Home Financials for this Owner
Home Financials are based on the most recent Mortgage that was taken out on this home.
Original Mortgage
$612,547
Interest Rate
3.58%
Mortgage Type
VA
Purchase Details
Closed on
Dec 11, 2015
Sold by
Cronin Joan T
Bought by
Palmer Roy and Palmer Laura
Home Financials for this Owner
Home Financials are based on the most recent Mortgage that was taken out on this home.
Original Mortgage
$614,635
Interest Rate
3.83%
Mortgage Type
VA
Create a Home Valuation Report for This Property
The Home Valuation Report is an in-depth analysis detailing your home's value as well as a comparison with similar homes in the area
Home Values in the Area
Average Home Value in this Area
Purchase History
| Date | Buyer | Sale Price | Title Company |
|---|---|---|---|
| Palmer Trust | -- | None Listed On Document | |
| Palmer Roy D | -- | North American Title Co Inc | |
| Palmer Roy | $595,000 | North American Title Co Inc |
Source: Public Records
Mortgage History
| Date | Status | Borrower | Loan Amount |
|---|---|---|---|
| Previous Owner | Palmer Roy D | $612,547 | |
| Previous Owner | Palmer Roy | $614,635 |
Source: Public Records
Tax History Compared to Growth
Tax History
| Year | Tax Paid | Tax Assessment Tax Assessment Total Assessment is a certain percentage of the fair market value that is determined by local assessors to be the total taxable value of land and additions on the property. | Land | Improvement |
|---|---|---|---|---|
| 2025 | $9,287 | $780,909 | $497,191 | $283,718 |
| 2024 | $9,135 | $765,598 | $487,443 | $278,155 |
| 2023 | $9,135 | $750,587 | $477,886 | $272,701 |
| 2022 | $9,057 | $735,870 | $468,516 | $267,354 |
| 2021 | $8,863 | $721,442 | $459,330 | $262,112 |
| 2019 | $7,895 | $631,418 | $445,707 | $185,711 |
| 2018 | $7,617 | $619,038 | $436,968 | $182,070 |
| 2017 | $7,403 | $606,900 | $428,400 | $178,500 |
| 2016 | $7,360 | $595,000 | $420,000 | $175,000 |
| 2015 | $1,602 | $97,834 | $38,430 | $59,404 |
| 2014 | $1,560 | $95,919 | $37,678 | $58,241 |
Source: Public Records
Map
Nearby Homes
- 576 Best Rd
- 1919 Helen Rd Unit 2
- 500 Creekside Rd
- 505 Tananger Heights Ct
- 277 Gloria Dr
- 900 Kimberly Cir
- 589 Maureen Ln
- 109 Haven Cir
- 117 Haven Cir
- 368 Grapevine Place
- 1772 Ruth Dr
- 2422 Pleasant Hill Rd Unit 6
- 2951 Hannan Dr
- 2162 Orin Ln
- 1601 Ruth Dr
- 309 Sunset Rd
- 5 Harwich Walk Unit 55
- 58 Ramsgate Ln
- 616 Aleta Place
- 107 Doris Dr