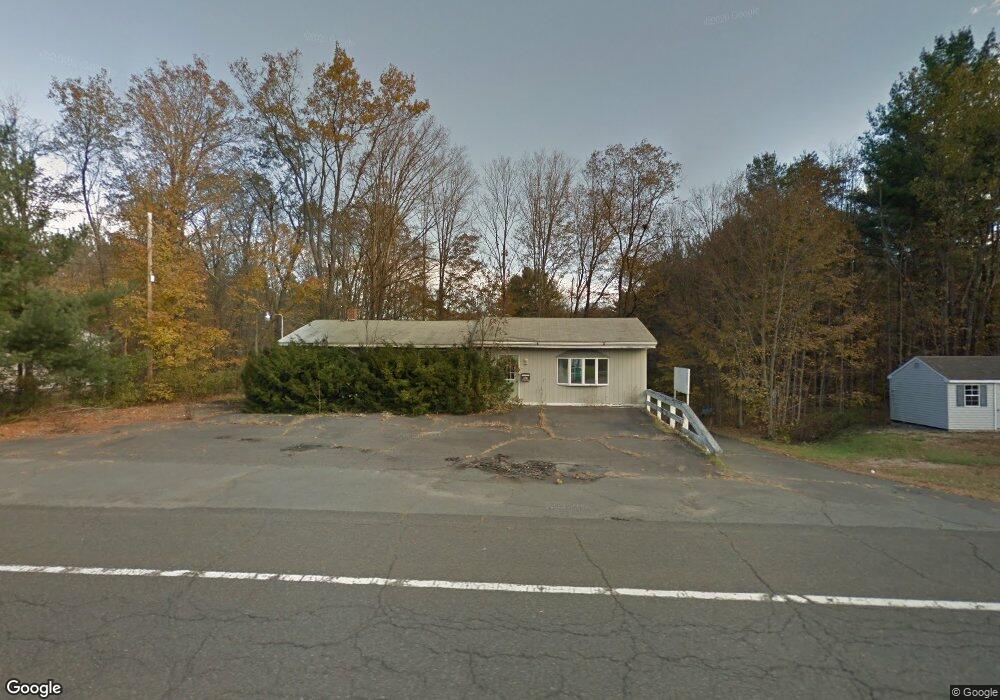
527 S Main St Orange, MA 01364
Estimated Value: $165,617
--
Bed
2
Baths
2,736
Sq Ft
$61/Sq Ft
Est. Value
About This Home
This home is located at 527 S Main St, Orange, MA 01364 and is currently estimated at $165,617, approximately $60 per square foot. 527 S Main St is a home located in Franklin County with nearby schools including Fisher Hill and Ralph C Mahar Regional School.
Ownership History
Date
Name
Owned For
Owner Type
Purchase Details
Closed on
Sep 5, 2012
Sold by
Hardie John H and Td Bank Na
Bought by
Harper Raymond D
Current Estimated Value
Purchase Details
Closed on
Oct 15, 2003
Sold by
Anderholm Linda J and Anderholm Martin S
Bought by
Krause Hardie Jon H and Krause Hardie Rebecca
Create a Home Valuation Report for This Property
The Home Valuation Report is an in-depth analysis detailing your home's value as well as a comparison with similar homes in the area
Home Values in the Area
Average Home Value in this Area
Purchase History
| Date | Buyer | Sale Price | Title Company |
|---|---|---|---|
| Harper Raymond D | $30,000 | -- | |
| Harper Raymond D | $30,000 | -- | |
| Harper Raymond D | $30,000 | -- | |
| Krause Hardie Jon H | $64,000 | -- | |
| Hardie Jon H | $64,000 | -- |
Source: Public Records
Mortgage History
| Date | Status | Borrower | Loan Amount |
|---|---|---|---|
| Previous Owner | Hardie Jon H | $140,000 | |
| Previous Owner | Hardie Jon H | $72,000 | |
| Previous Owner | Hardie Jon H | $105,000 |
Source: Public Records
Tax History Compared to Growth
Tax History
| Year | Tax Paid | Tax Assessment Tax Assessment Total Assessment is a certain percentage of the fair market value that is determined by local assessors to be the total taxable value of land and additions on the property. | Land | Improvement |
|---|---|---|---|---|
| 2025 | $26 | $155,200 | $72,900 | $82,300 |
| 2024 | $2,677 | $153,500 | $73,500 | $80,000 |
| 2023 | $2,757 | $153,500 | $73,500 | $80,000 |
| 2022 | $2,935 | $153,500 | $73,500 | $80,000 |
| 2021 | $3,449 | $172,000 | $73,800 | $98,200 |
| 2020 | $2,878 | $166,300 | $70,800 | $95,500 |
| 2019 | $3,369 | $149,600 | $63,400 | $86,200 |
| 2018 | $3,162 | $144,100 | $60,600 | $83,500 |
| 2017 | $3,059 | $144,100 | $60,600 | $83,500 |
| 2016 | $3,055 | $140,800 | $46,600 | $94,200 |
| 2015 | $3,105 | $149,500 | $46,600 | $102,900 |
| 2014 | $2,953 | $149,600 | $46,600 | $103,000 |
Source: Public Records
Map
Nearby Homes
- 00 S Main St
- 000 S Main St
- 490 S Main St
- 610 S Main St
- 295 S Main St
- 0 S Main St
- 257 S Main St
- 121 Pleasant St
- 114 S Main St
- 270 Holtshire Rd
- 35 W River St
- 27 Chase St
- 248 Holtshire Rd Unit Lot 2
- 50 E Main St
- 12-14 E Main St
- 43 W Main St
- 222 W River St
- 89 W Main St
- 52 Mechanic St
- 36 Summit St Unit A