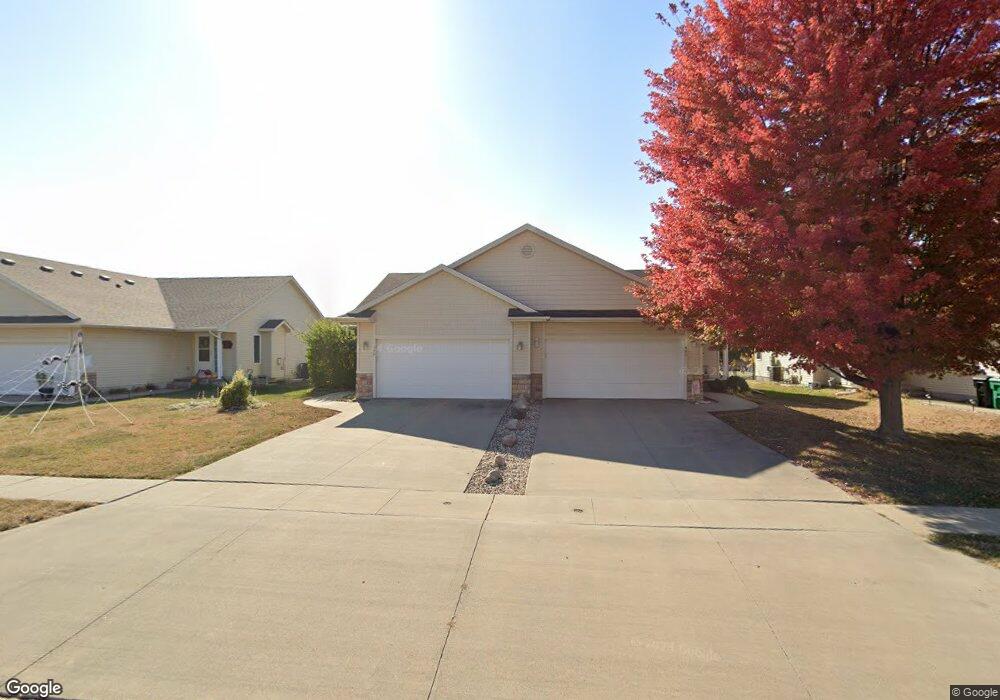
527 SW 46th St Ankeny, IA 50023
Southwest Ankeny NeighborhoodEstimated Value: $244,000 - $261,000
3
Beds
1
Bath
1,036
Sq Ft
$245/Sq Ft
Est. Value
About This Home
This home is located at 527 SW 46th St, Ankeny, IA 50023 and is currently estimated at $254,280, approximately $245 per square foot. 527 SW 46th St is a home located in Polk County with nearby schools including Southview Middle School, Parkview Middle School, and Ankeny High School.
Ownership History
Date
Name
Owned For
Owner Type
Purchase Details
Closed on
Aug 9, 2008
Sold by
Crabtree Robert J and Crabtree Carrie A
Bought by
Langenwalter Monica J
Current Estimated Value
Home Financials for this Owner
Home Financials are based on the most recent Mortgage that was taken out on this home.
Original Mortgage
$116,800
Outstanding Balance
$76,677
Interest Rate
6.42%
Mortgage Type
Purchase Money Mortgage
Estimated Equity
$177,603
Purchase Details
Closed on
Mar 24, 2006
Sold by
Northwood Townhomes Llc
Bought by
Crabtree Robert J and Crabtree Carrie A
Home Financials for this Owner
Home Financials are based on the most recent Mortgage that was taken out on this home.
Original Mortgage
$121,380
Interest Rate
8.12%
Mortgage Type
Fannie Mae Freddie Mac
Create a Home Valuation Report for This Property
The Home Valuation Report is an in-depth analysis detailing your home's value as well as a comparison with similar homes in the area
Home Values in the Area
Average Home Value in this Area
Purchase History
| Date | Buyer | Sale Price | Title Company |
|---|---|---|---|
| Langenwalter Monica J | $145,500 | Itc | |
| Crabtree Robert J | $151,500 | None Available |
Source: Public Records
Mortgage History
| Date | Status | Borrower | Loan Amount |
|---|---|---|---|
| Open | Langenwalter Monica J | $116,800 | |
| Previous Owner | Crabtree Robert J | $30,345 | |
| Previous Owner | Crabtree Robert J | $121,380 |
Source: Public Records
Tax History Compared to Growth
Tax History
| Year | Tax Paid | Tax Assessment Tax Assessment Total Assessment is a certain percentage of the fair market value that is determined by local assessors to be the total taxable value of land and additions on the property. | Land | Improvement |
|---|---|---|---|---|
| 2025 | $3,526 | $252,900 | $45,400 | $207,500 |
| 2024 | $3,526 | $217,300 | $38,600 | $178,700 |
| 2023 | $3,660 | $217,300 | $38,600 | $178,700 |
| 2022 | $3,660 | $185,400 | $33,900 | $151,500 |
| 2021 | $3,618 | $185,400 | $33,900 | $151,500 |
| 2020 | $3,536 | $173,500 | $31,700 | $141,800 |
| 2019 | $3,186 | $173,500 | $31,700 | $141,800 |
| 2018 | $3,176 | $150,000 | $26,900 | $123,100 |
| 2017 | $3,374 | $150,000 | $26,900 | $123,100 |
| 2016 | $3,370 | $150,000 | $21,600 | $128,400 |
| 2015 | $3,370 | $150,000 | $21,600 | $128,400 |
| 2014 | $3,094 | $138,500 | $22,200 | $116,300 |
Source: Public Records
Map
Nearby Homes
- 402 SW 48th St
- 818 SW 46th St
- 827 SW 46th St
- 407 SW Springfield Dr
- 126 SW 36th Ln
- 3206 SE Turnberry Dr
- 3803 SW Franklin Dr
- 4103 SW Westview Dr
- 2914 SW Pleasant St
- 223 SE 33rd St
- 3207 SE Turnberry Dr
- 3901 NE 70th Ave
- 213 SW Carriage Dr
- 3010 SE Turnberry Dr
- Chester Plan at Greens at Woodland Hills
- Cedar Plan at Greens at Woodland Hills
- Jasmine Plan at Greens at Woodland Hills
- Forrester Plan at Greens at Woodland Hills
- Hampton Plan at Greens at Woodland Hills
- Melrose Plan at Greens at Woodland Hills