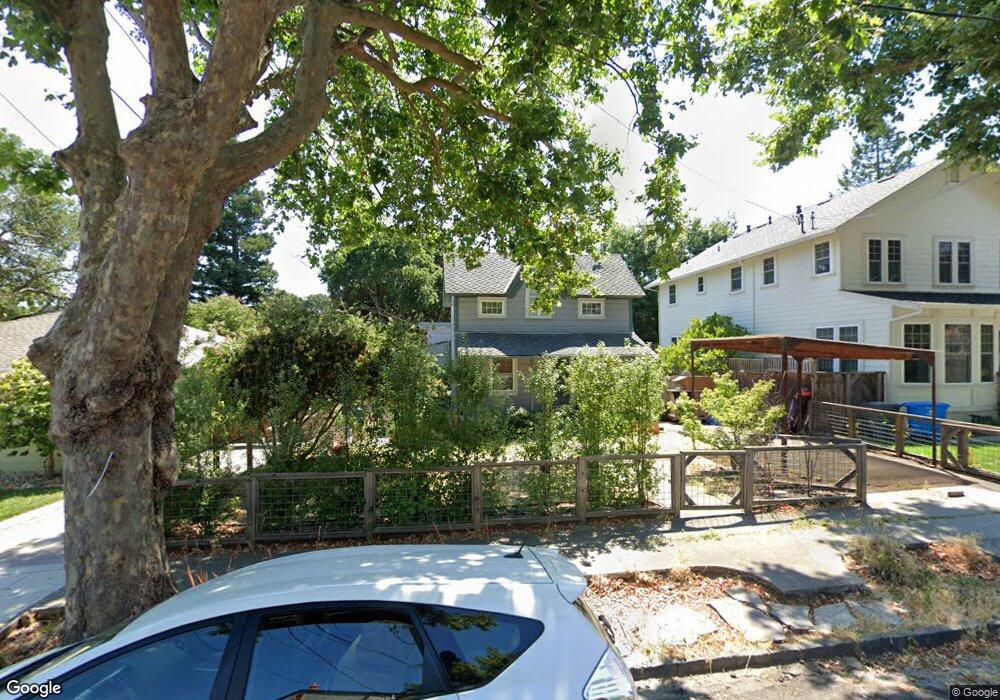
527 Upham St Petaluma, CA 94952
Western Petaluma NeighborhoodEstimated Value: $943,230 - $1,228,000
4
Beds
1
Bath
2,188
Sq Ft
$493/Sq Ft
Est. Value
About This Home
This home is located at 527 Upham St, Petaluma, CA 94952 and is currently estimated at $1,079,058, approximately $493 per square foot. 527 Upham St is a home located in Sonoma County with nearby schools including Valley Vista Elementary School, Petaluma Junior High School, and Petaluma High School.
Ownership History
Date
Name
Owned For
Owner Type
Purchase Details
Closed on
Feb 22, 2016
Sold by
Smith Robert J and Wallace Devery L
Bought by
Lorentz Sean Paul and Lorentz Seair W
Current Estimated Value
Home Financials for this Owner
Home Financials are based on the most recent Mortgage that was taken out on this home.
Original Mortgage
$417,000
Outstanding Balance
$332,101
Interest Rate
3.92%
Mortgage Type
New Conventional
Estimated Equity
$746,957
Purchase Details
Closed on
Aug 28, 2013
Sold by
Meadows Grady M and Bishop Mary Catherine
Bought by
Lorentz Sean Paul and Lorentz Seair W
Home Financials for this Owner
Home Financials are based on the most recent Mortgage that was taken out on this home.
Original Mortgage
$417,000
Interest Rate
4.27%
Mortgage Type
New Conventional
Purchase Details
Closed on
Aug 25, 2011
Sold by
Meadows Grady and Bishop Mary C
Bought by
Meadows Grady M and Bishop Mary Catherine
Purchase Details
Closed on
Mar 7, 2001
Sold by
Parsons David and Parsons Family Trust
Bought by
Meadows Grady and Bishop Mary C
Home Financials for this Owner
Home Financials are based on the most recent Mortgage that was taken out on this home.
Original Mortgage
$292,000
Interest Rate
7.12%
Purchase Details
Closed on
Mar 9, 1999
Sold by
Parsons Wayne F and Parsons Dorothy L
Bought by
Parsons Wayne F and Parsons Dorothy L
Home Financials for this Owner
Home Financials are based on the most recent Mortgage that was taken out on this home.
Original Mortgage
$150,000
Interest Rate
6.78%
Purchase Details
Closed on
Feb 22, 1999
Sold by
Parsons Wayne F and Parsons Dorothy L
Bought by
Parsons Wayne F and Parsons Dorothy L
Home Financials for this Owner
Home Financials are based on the most recent Mortgage that was taken out on this home.
Original Mortgage
$150,000
Interest Rate
6.78%
Purchase Details
Closed on
Dec 2, 1994
Sold by
Parsons Wayne F and Parsons Dorothy L
Bought by
Parsons Wayne F and Parsons Dorothy L
Create a Home Valuation Report for This Property
The Home Valuation Report is an in-depth analysis detailing your home's value as well as a comparison with similar homes in the area
Home Values in the Area
Average Home Value in this Area
Purchase History
| Date | Buyer | Sale Price | Title Company |
|---|---|---|---|
| Lorentz Sean Paul | $212,727 | Old Republic Title Company | |
| Lorentz Sean Paul | $600,000 | First American Title Company | |
| Meadows Grady M | -- | None Available | |
| Meadows Grady | -- | None Available | |
| Meadows Grady | $365,000 | Old Republic Title Company | |
| Parsons Wayne F | -- | -- | |
| Parsons Wayne F | -- | First American Title | |
| Parsons Wayne F | -- | -- |
Source: Public Records
Mortgage History
| Date | Status | Borrower | Loan Amount |
|---|---|---|---|
| Open | Lorentz Sean Paul | $417,000 | |
| Previous Owner | Lorentz Sean Paul | $417,000 | |
| Previous Owner | Meadows Grady | $292,000 | |
| Previous Owner | Parsons Wayne F | $150,000 |
Source: Public Records
Tax History
| Year | Tax Paid | Tax Assessment Tax Assessment Total Assessment is a certain percentage of the fair market value that is determined by local assessors to be the total taxable value of land and additions on the property. | Land | Improvement |
|---|---|---|---|---|
| 2025 | $7,886 | $735,505 | $294,200 | $441,305 |
| 2024 | $7,886 | $721,084 | $288,432 | $432,652 |
| 2023 | $7,886 | $706,946 | $282,777 | $424,169 |
| 2022 | $7,638 | $693,085 | $277,233 | $415,852 |
| 2021 | $7,493 | $679,497 | $271,798 | $407,699 |
| 2020 | $7,556 | $672,531 | $269,012 | $403,519 |
| 2019 | $7,462 | $659,345 | $263,738 | $395,607 |
| 2018 | $7,432 | $646,417 | $258,567 | $387,850 |
| 2017 | $7,275 | $633,744 | $253,498 | $380,246 |
| 2016 | $7,119 | $621,319 | $248,528 | $372,791 |
| 2015 | $7,083 | $611,987 | $244,795 | $367,192 |
| 2014 | $7,049 | $600,000 | $240,000 | $360,000 |
Source: Public Records
Map
Nearby Homes
Your Personal Tour Guide
Ask me questions while you tour the home.