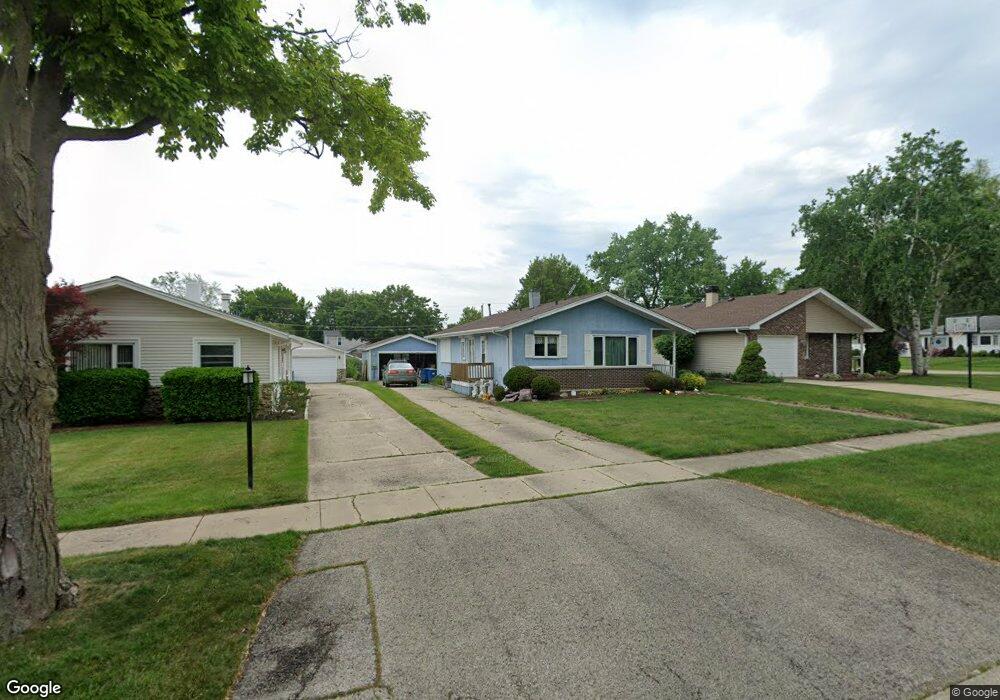
527 W North Ave Bartlett, IL 60103
Estimated Value: $282,000 - $386,000
3
Beds
2
Baths
1,559
Sq Ft
$226/Sq Ft
Est. Value
About This Home
This home is located at 527 W North Ave, Bartlett, IL 60103 and is currently estimated at $351,871, approximately $225 per square foot. 527 W North Ave is a home located in Cook County with nearby schools including Bartlett Elementary School, Eastview Middle School, and South Elgin High School.
Ownership History
Date
Name
Owned For
Owner Type
Purchase Details
Closed on
Aug 22, 2019
Sold by
Eakin Kenneth J and Eakin Karin I
Bought by
Carlino Terrance J and Carlino Korrina S
Current Estimated Value
Home Financials for this Owner
Home Financials are based on the most recent Mortgage that was taken out on this home.
Original Mortgage
$142,373
Outstanding Balance
$125,301
Interest Rate
4.25%
Mortgage Type
FHA
Estimated Equity
$226,570
Purchase Details
Closed on
Nov 20, 2012
Sold by
Carlino Korrina S
Bought by
Eakin Kenneth J and Eakin Karin I
Purchase Details
Closed on
Oct 1, 2012
Sold by
Carlino Terrence
Bought by
Carlino Korrina
Purchase Details
Closed on
Oct 13, 1998
Sold by
Carlino John R and Carlino Lorine A
Bought by
Carlino Terrence J and Carlino Korrina S
Create a Home Valuation Report for This Property
The Home Valuation Report is an in-depth analysis detailing your home's value as well as a comparison with similar homes in the area
Home Values in the Area
Average Home Value in this Area
Purchase History
We collect this data history from publicly available records. To have your information removed, we recommend requesting removal directly through your county’s website.
| Date | Buyer | Sale Price | Title Company |
|---|---|---|---|
| Carlino Terrance J | $145,000 | National Title Solutions Inc | |
| Eakin Kenneth J | -- | None Available | |
| Carlino Korrina | -- | None Available | |
| Carlino Terrence J | -- | -- |
Source: Public Records
Mortgage History
We collect this data history from publicly available records. To have your information removed, we recommend requesting removal directly through your county’s website.
| Date | Status | Borrower | Loan Amount |
|---|---|---|---|
| Open | Carlino Terrance J | $142,373 |
Source: Public Records
Tax History
| Year | Tax Paid | Tax Assessment Tax Assessment Total Assessment is a certain percentage of the fair market value that is determined by local assessors to be the total taxable value of land and additions on the property. | Land | Improvement |
|---|---|---|---|---|
| 2025 | $7,913 | $32,000 | $5,215 | $26,785 |
| 2024 | $7,913 | $25,000 | $3,725 | $21,275 |
| 2023 | $7,646 | $25,000 | $3,725 | $21,275 |
| 2022 | $7,646 | $25,000 | $3,725 | $21,275 |
| 2021 | $7,582 | $20,404 | $3,166 | $17,238 |
| 2020 | $7,481 | $20,404 | $3,166 | $17,238 |
| 2019 | $7,518 | $22,926 | $3,166 | $19,760 |
| 2018 | $8,460 | $23,666 | $2,793 | $20,873 |
| 2017 | $8,318 | $23,666 | $2,793 | $20,873 |
| 2016 | $6,947 | $23,666 | $2,793 | $20,873 |
| 2015 | $7,416 | $23,533 | $2,421 | $21,112 |
| 2014 | $7,341 | $23,533 | $2,421 | $21,112 |
| 2013 | $7,039 | $23,533 | $2,421 | $21,112 |
Source: Public Records
Map
Nearby Homes
- 122 Williamsburg Dr
- 401 W Oneida Ave
- 403 W Oneida Ave
- 311 W North Ave
- 238 S Devon Ave
- 420 Ford Ln
- 323 Ford Ln
- 241 S Main St Unit 215
- 106 S Elroy Ave
- 102 N Berteau Ave
- 749 Holly Dr
- 207 N Crest Ave
- 603 Route 59
- SWC Illinois Route 59
- 119 E Railroad Ave
- 249 Surrey Rd
- 150 Shady Ln
- 1032 W Park Place Dr
- 110 N Chase Ave
- 194 Robert Ct Unit A
- 134 Williamsburg Dr
- 110 Williamsburg Dr
- 146 Williamsburg Dr
- 111 Williamsburg Dr
- 158 Williamsburg Dr
- 131 Williamsburg Dr
- 514 W North Ave
- 523 W North Ave
- 143 Williamsburg Dr
- 105 Oliver St
- 519 W North Ave
- 170 Williamsburg Dr
- 153 Williamsburg Dr
- 496 W North Ave
- 515 W North Ave
- 104 Oliver St
- 104 Valley St
- 163 Williamsburg Dr
- 428 W North Ave Unit 1
- 541 W Morse Ave
Your Personal Tour Guide
Ask me questions while you tour the home.