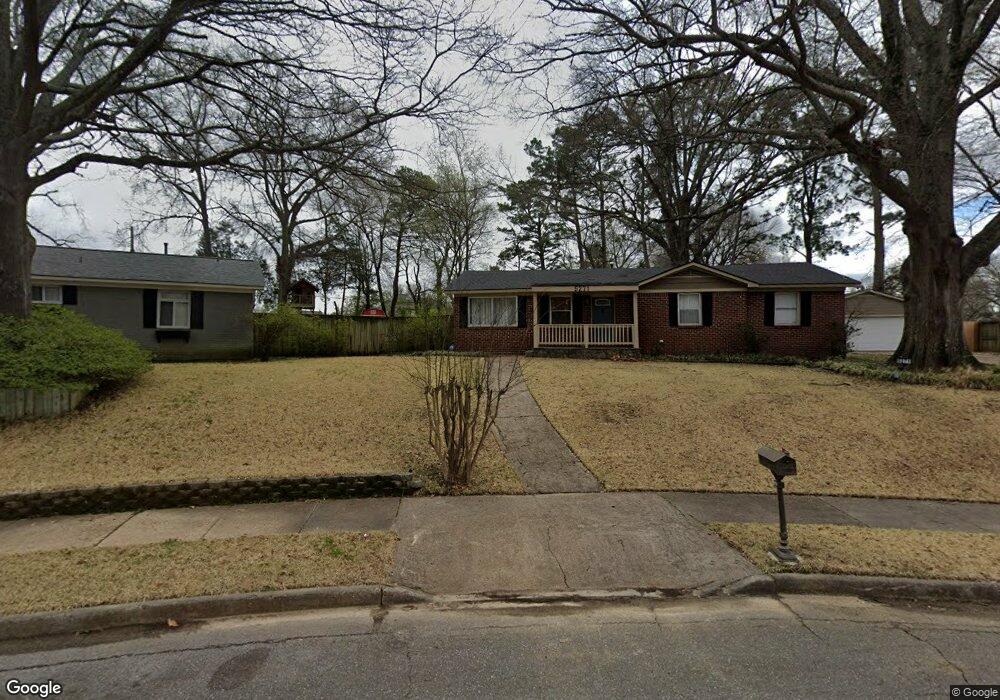
5271 Princeton Road Extension Memphis, TN 38120
Audubon Park NeighborhoodEstimated Value: $259,000 - $288,000
3
Beds
2
Baths
1,436
Sq Ft
$189/Sq Ft
Est. Value
About This Home
This home is located at 5271 Princeton Road Extension, Memphis, TN 38120 and is currently estimated at $270,832, approximately $188 per square foot. 5271 Princeton Road Extension is a home located in Shelby County with nearby schools including Richland Elementary School, White Station Middle, and White Station High.
Ownership History
Date
Name
Owned For
Owner Type
Purchase Details
Closed on
Jul 1, 2022
Sold by
Ruddick Kristie Renee
Bought by
Boyd Monica
Current Estimated Value
Home Financials for this Owner
Home Financials are based on the most recent Mortgage that was taken out on this home.
Original Mortgage
$212,000
Outstanding Balance
$201,971
Interest Rate
5.25%
Mortgage Type
New Conventional
Estimated Equity
$68,861
Purchase Details
Closed on
Jan 16, 2014
Sold by
Juang Steven
Bought by
Ruddick Kristie R
Home Financials for this Owner
Home Financials are based on the most recent Mortgage that was taken out on this home.
Original Mortgage
$156,120
Interest Rate
4.12%
Mortgage Type
FHA
Purchase Details
Closed on
Nov 26, 2012
Sold by
Regions Bank
Bought by
Juang Steve
Purchase Details
Closed on
Sep 21, 2012
Sold by
Fike James G
Bought by
Regions Bank
Create a Home Valuation Report for This Property
The Home Valuation Report is an in-depth analysis detailing your home's value as well as a comparison with similar homes in the area
Home Values in the Area
Average Home Value in this Area
Purchase History
| Date | Buyer | Sale Price | Title Company |
|---|---|---|---|
| Boyd Monica | $265,000 | Saddle Creek Title | |
| Ruddick Kristie R | $159,000 | None Available | |
| Juang Steve | $57,000 | Baymark Title And Escrow Ser | |
| Regions Bank | $90,876 | None Available |
Source: Public Records
Mortgage History
| Date | Status | Borrower | Loan Amount |
|---|---|---|---|
| Open | Boyd Monica | $212,000 | |
| Previous Owner | Ruddick Kristie R | $156,120 |
Source: Public Records
Tax History Compared to Growth
Tax History
| Year | Tax Paid | Tax Assessment Tax Assessment Total Assessment is a certain percentage of the fair market value that is determined by local assessors to be the total taxable value of land and additions on the property. | Land | Improvement |
|---|---|---|---|---|
| 2025 | $1,803 | $62,575 | $19,475 | $43,100 |
| 2024 | $1,803 | $53,175 | $14,900 | $38,275 |
| 2023 | $3,239 | $53,175 | $14,900 | $38,275 |
| 2022 | $3,239 | $53,175 | $14,900 | $38,275 |
| 2021 | $3,850 | $53,175 | $14,900 | $38,275 |
| 2020 | $3,221 | $44,450 | $14,900 | $29,550 |
| 2019 | $1,421 | $44,450 | $14,900 | $29,550 |
| 2018 | $1,421 | $44,450 | $14,900 | $29,550 |
| 2017 | $1,454 | $44,450 | $14,900 | $29,550 |
| 2016 | $1,814 | $41,500 | $0 | $0 |
| 2014 | $1,814 | $41,500 | $0 | $0 |
Source: Public Records
Map
Nearby Homes
- 446 Rosser Rd
- 496 Chalmers Rd
- 448 N White Station Rd
- 529 Fleda Rd
- 430 Mcelroy Rd
- 422 Mcelroy Rd
- 379 Mcelroy Rd
- 551 N White Station Rd
- 5137 Whitehall Ave
- 536 Wheaton Park Cove N
- 5238 Peg Ln
- 5362 Wilton Ave
- 580 N Oak Grove Rd
- 5176 White Cliff Dr
- 5119 Tarrytown Dr
- 296 N White Station Rd
- 5121 Lynbar Ave
- 258 N White Station Rd
- 432 Malboro Rd
- 424 Malboro Rd
- 5271 Princeton Ave
- 5271 Princeton Rd
- 474 Chalmers Rd
- 5265 Princeton Road Extension
- 442 Rosser Rd
- 5265 Princeton Rd
- 5289 Abbie Woods Cove
- 438 Rosser Rd
- 5296 W Maxima Cove
- 5259 Princeton Road Extension
- 5293 Abbie Woods Cove
- 480 Chalmers Rd
- 5300 W Maxima Cove
- 5264 Princeton Road Extension
- 448 Rosser Rd
- 5295 W Maxima Cove
- 5251 Princeton Rd
- 430 Rosser Rd
- 5258 Princeton Rd
- 5251 Princeton Extension