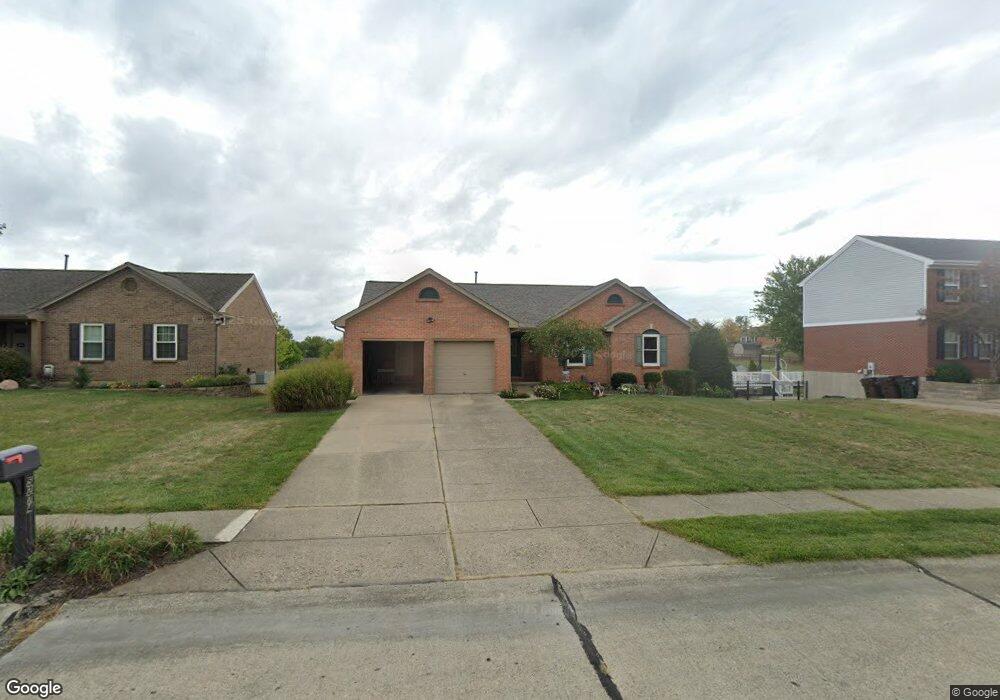
5274 Millcreek Cir Independence, KY 41051
Estimated Value: $322,383 - $336,000
3
Beds
3
Baths
1,480
Sq Ft
$223/Sq Ft
Est. Value
About This Home
This home is located at 5274 Millcreek Cir, Independence, KY 41051 and is currently estimated at $330,596, approximately $223 per square foot. 5274 Millcreek Cir is a home located in Kenton County with nearby schools including White's Tower Elementary School, Twenhofel Middle School, and Simon Kenton High School.
Ownership History
Date
Name
Owned For
Owner Type
Purchase Details
Closed on
May 1, 2019
Sold by
Ward David W and Ward Jennie L
Bought by
Davis Ronald L and Davis Rosemary A
Current Estimated Value
Home Financials for this Owner
Home Financials are based on the most recent Mortgage that was taken out on this home.
Original Mortgage
$169,600
Outstanding Balance
$148,187
Interest Rate
4.2%
Mortgage Type
New Conventional
Estimated Equity
$182,409
Purchase Details
Closed on
Jun 5, 2008
Sold by
Deters Richard H and Deters Jean A
Bought by
Ward David W and Ward Jennie L
Purchase Details
Closed on
Jun 14, 1994
Sold by
Arlinghaus Builders Inc
Bought by
Deters Richard H and Deters Andrew Jean
Home Financials for this Owner
Home Financials are based on the most recent Mortgage that was taken out on this home.
Original Mortgage
$80,000
Interest Rate
8.27%
Mortgage Type
New Conventional
Create a Home Valuation Report for This Property
The Home Valuation Report is an in-depth analysis detailing your home's value as well as a comparison with similar homes in the area
Home Values in the Area
Average Home Value in this Area
Purchase History
| Date | Buyer | Sale Price | Title Company |
|---|---|---|---|
| Davis Ronald L | $212,000 | Kentucky Land Title Agcy Inc | |
| Ward David W | $169,000 | Kentucky Land Title Agency | |
| Deters Richard H | $115,381 | -- |
Source: Public Records
Mortgage History
| Date | Status | Borrower | Loan Amount |
|---|---|---|---|
| Open | Davis Ronald L | $169,600 | |
| Previous Owner | Deters Richard H | $80,000 |
Source: Public Records
Tax History Compared to Growth
Tax History
| Year | Tax Paid | Tax Assessment Tax Assessment Total Assessment is a certain percentage of the fair market value that is determined by local assessors to be the total taxable value of land and additions on the property. | Land | Improvement |
|---|---|---|---|---|
| 2025 | $2,288 | $245,800 | $40,000 | $205,800 |
| 2024 | $2,029 | $212,000 | $30,000 | $182,000 |
| 2023 | $2,090 | $212,000 | $30,000 | $182,000 |
| 2022 | $2,226 | $212,000 | $30,000 | $182,000 |
| 2021 | $2,259 | $212,000 | $30,000 | $182,000 |
| 2020 | $2,322 | $212,000 | $30,000 | $182,000 |
| 2019 | $2,280 | $169,000 | $30,000 | $139,000 |
| 2018 | $2,292 | $169,000 | $30,000 | $139,000 |
| 2017 | $2,230 | $169,000 | $30,000 | $139,000 |
| 2015 | $2,165 | $169,000 | $30,000 | $139,000 |
| 2014 | $2,134 | $169,000 | $30,000 | $139,000 |
Source: Public Records
Map
Nearby Homes
- 5267 Pioneer Dr
- 10737 Cypresswood Dr
- 1804 Cypress Way
- 10741 Lakefront Cir
- 5186 Christopher Dr
- 10434 Sharpsburg Dr
- 810 Durrow Dr Unit Lot 14
- 89 Bradley Dr
- 958 Don Victor
- 72 Sherwood Dr
- 6681 Tullamore Ln Unit Lot 3
- 772 Durrow Dr Unit Lot 26
- 6703 Tullamore Ln Unit Lot 7
- 64 Sylvan Dr
- 860 Stephens Rd
- 4389 Alleen Ct
- 5086 Woodale Ct
- 11147 Stafford Heights Rd
- 10383 Lynchburg Dr
- 109 Sylvan Dr
- 5270 Millcreek Cir
- 5278 Millcreek Cir
- 5266 Millcreek Cir
- 5282 Millcreek Cir
- 5277 Millcreek Cir
- 5273 Millcreek Cir
- 5262 Millcreek Cir
- 5286 Millcreek Cir
- 5281 Millcreek Cir
- 5269 Millcreek Cir
- 48 Millcreek Cir
- 5285 Millcreek Cir
- 5265 Millcreek Cir
- 5258 Millcreek Cir
- 5290 Millcreek Cir
- 5289 Millcreek Cir
- 5228 Millcreek Cir
- 5261 Millcreek Cir
- 5294 Millcreek Cir
- 5224 Millcreek Cir