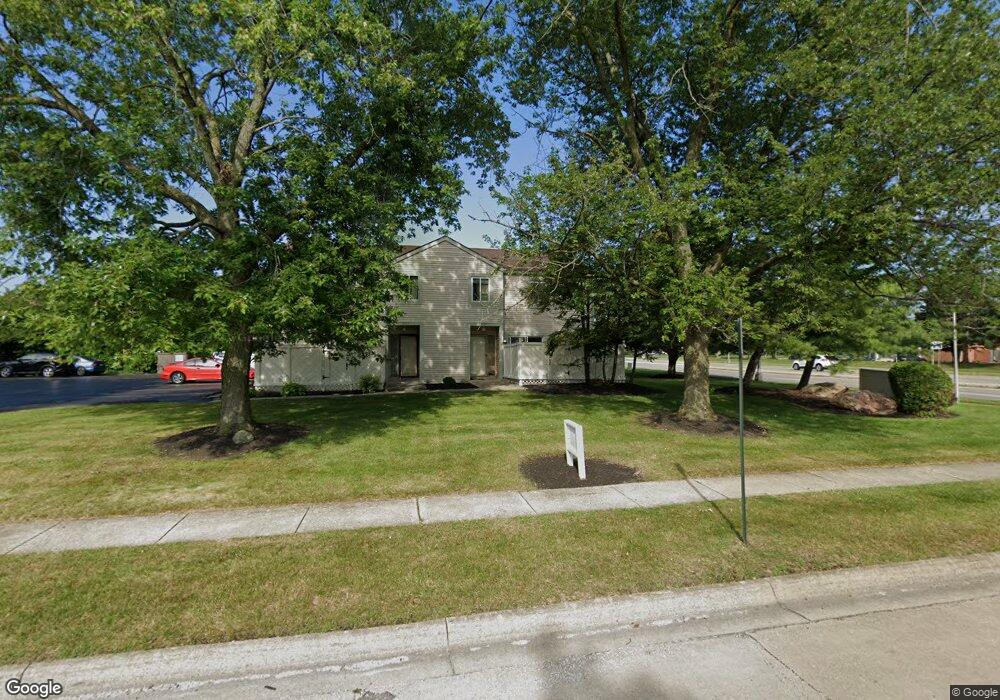
5275 Captains Ct Unit 5275B Columbus, OH 43220
Northcrest NeighborhoodEstimated Value: $181,000 - $222,098
3
Beds
3
Baths
1,056
Sq Ft
$198/Sq Ft
Est. Value
About This Home
This home is located at 5275 Captains Ct Unit 5275B, Columbus, OH 43220 and is currently estimated at $209,025, approximately $197 per square foot. 5275 Captains Ct Unit 5275B is a home located in Franklin County with nearby schools including Winterset Elementary School, Ridgeview Middle School, and Centennial High School.
Ownership History
Date
Name
Owned For
Owner Type
Purchase Details
Closed on
Apr 17, 2015
Sold by
Linnenbom Victor A
Bought by
Gebreab Habeteab E
Current Estimated Value
Home Financials for this Owner
Home Financials are based on the most recent Mortgage that was taken out on this home.
Original Mortgage
$78,850
Outstanding Balance
$60,166
Interest Rate
3.5%
Mortgage Type
Adjustable Rate Mortgage/ARM
Estimated Equity
$148,859
Purchase Details
Closed on
Jul 12, 2007
Sold by
Carlson Michael
Bought by
Linnenbom Victor A
Home Financials for this Owner
Home Financials are based on the most recent Mortgage that was taken out on this home.
Original Mortgage
$100,500
Interest Rate
6.27%
Mortgage Type
Purchase Money Mortgage
Purchase Details
Closed on
Dec 12, 2005
Sold by
Cunard Village Llc
Bought by
Carlson Michael
Home Financials for this Owner
Home Financials are based on the most recent Mortgage that was taken out on this home.
Original Mortgage
$95,000
Interest Rate
9.4%
Mortgage Type
Fannie Mae Freddie Mac
Purchase Details
Closed on
Dec 1, 1983
Create a Home Valuation Report for This Property
The Home Valuation Report is an in-depth analysis detailing your home's value as well as a comparison with similar homes in the area
Home Values in the Area
Average Home Value in this Area
Purchase History
| Date | Buyer | Sale Price | Title Company |
|---|---|---|---|
| Gebreab Habeteab E | $83,000 | None Available | |
| Linnenbom Victor A | $100,500 | Premiere Ti | |
| Carlson Michael | $95,000 | -- | |
| -- | -- | -- |
Source: Public Records
Mortgage History
| Date | Status | Borrower | Loan Amount |
|---|---|---|---|
| Open | Gebreab Habeteab E | $78,850 | |
| Previous Owner | Linnenbom Victor A | $100,500 | |
| Previous Owner | Carlson Michael | $95,000 |
Source: Public Records
Tax History Compared to Growth
Tax History
| Year | Tax Paid | Tax Assessment Tax Assessment Total Assessment is a certain percentage of the fair market value that is determined by local assessors to be the total taxable value of land and additions on the property. | Land | Improvement |
|---|---|---|---|---|
| 2024 | $2,717 | $60,550 | $22,050 | $38,500 |
| 2023 | $2,683 | $60,550 | $22,050 | $38,500 |
| 2022 | $1,870 | $36,050 | $5,040 | $31,010 |
| 2021 | $1,873 | $36,050 | $5,040 | $31,010 |
| 2020 | $1,875 | $36,050 | $5,040 | $31,010 |
| 2019 | $1,822 | $30,030 | $4,200 | $25,830 |
| 2018 | $1,715 | $30,030 | $4,200 | $25,830 |
| 2017 | $1,798 | $30,030 | $4,200 | $25,830 |
| 2016 | $1,776 | $26,810 | $4,480 | $22,330 |
| 2015 | $1,612 | $26,810 | $4,480 | $22,330 |
| 2014 | $1,616 | $26,810 | $4,480 | $22,330 |
| 2013 | $937 | $31,500 | $5,250 | $26,250 |
Source: Public Records
Map
Nearby Homes
- 5268 Captains Ct
- 5283 Ruthton Rd Unit 19
- 5108 Ranstead Ct
- 2229 Teardrop Ave Unit 35E
- 1865 Willoway Cir N Unit 1865
- 5294 Brandy Oaks Ln
- 1739 Paula Dr Unit 1739
- 1683 Saint Albans Ct Unit 22-83
- 5624 Wigmore Dr Unit 50B
- 1835 Willoway Cir N
- 5273 Brandy Oaks Ln
- 5111 Schuylkill St
- 2540 Dahlia Way Unit 26D
- 2260 Lila Way Unit 62D
- 4924 Reed Rd Unit B
- 2491 Calais Way
- 2165 Partlow Dr
- 2198 Sandston Rd
- 2560 Trotterslane Dr
- 2231 Atlee Ct Unit 12
- 5188-5274 Captains Ct
- 5275 Captains Ct Unit B
- 5273 Captains Ct
- 5279 Captains Ct Unit D5279
- 5279 Captains Ct Unit D
- 5277 Captains Ct Unit 5277C
- 5277 Captains Ct Unit C
- 0 Captains Ct
- 5265 Captains Ct Unit B5265
- 5265 Captains Ct
- 5269 Captains Ct Unit 5269D
- 5269 Captains Ct Unit D
- 5263 Captains Ct
- 5267 Captains Ct
- 2121 Bethel Rd
- 5274 Captains Ct
- 5278 Captains Ct
- 5278 Captains Ct Unit C 5278
- 5280 Captains Ct Unit D5280
- 5259 Captains Ct Unit D5259