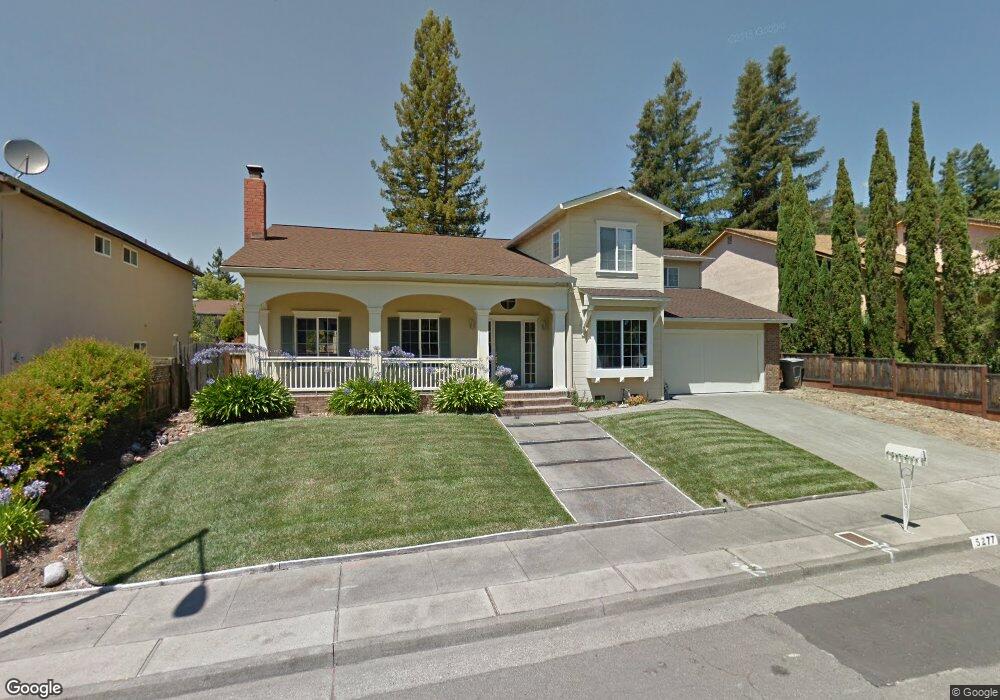
5277 San Luis Ave Santa Rosa, CA 95409
Skyhawk NeighborhoodEstimated Value: $853,505 - $983,000
4
Beds
3
Baths
2,196
Sq Ft
$413/Sq Ft
Est. Value
About This Home
This home is located at 5277 San Luis Ave, Santa Rosa, CA 95409 and is currently estimated at $905,876, approximately $412 per square foot. 5277 San Luis Ave is a home located in Sonoma County with nearby schools including Sequoia Elementary School, Rincon Valley Middle School, and Maria Carrillo High School.
Ownership History
Date
Name
Owned For
Owner Type
Purchase Details
Closed on
Aug 10, 2016
Sold by
Kearns Joshua M and Kearns Lisa
Bought by
Batzdorff Kearns Joshua M and Batzdorff Kearns Lisa B
Current Estimated Value
Purchase Details
Closed on
Mar 3, 2015
Sold by
Armstrong Gratz L and Armstrong Cynthia J
Bought by
Kearns Joshua M and Kearns Lisa
Home Financials for this Owner
Home Financials are based on the most recent Mortgage that was taken out on this home.
Original Mortgage
$300,000
Outstanding Balance
$228,833
Interest Rate
3.57%
Mortgage Type
New Conventional
Estimated Equity
$677,043
Purchase Details
Closed on
Sep 25, 1995
Sold by
Kalman Daisy and Kalman Adam Stephen
Bought by
Armstrong Gratz L and Armstrong Cynthia J
Home Financials for this Owner
Home Financials are based on the most recent Mortgage that was taken out on this home.
Original Mortgage
$225,000
Interest Rate
7.92%
Create a Home Valuation Report for This Property
The Home Valuation Report is an in-depth analysis detailing your home's value as well as a comparison with similar homes in the area
Home Values in the Area
Average Home Value in this Area
Purchase History
| Date | Buyer | Sale Price | Title Company |
|---|---|---|---|
| Batzdorff Kearns Joshua M | -- | None Available | |
| Kearns Joshua M | $630,000 | Fidelity National Title Co | |
| Armstrong Gratz L | $186,000 | Fidelity National Title Ins |
Source: Public Records
Mortgage History
| Date | Status | Borrower | Loan Amount |
|---|---|---|---|
| Open | Kearns Joshua M | $300,000 | |
| Previous Owner | Armstrong Gratz L | $225,000 |
Source: Public Records
Tax History Compared to Growth
Tax History
| Year | Tax Paid | Tax Assessment Tax Assessment Total Assessment is a certain percentage of the fair market value that is determined by local assessors to be the total taxable value of land and additions on the property. | Land | Improvement |
|---|---|---|---|---|
| 2025 | $8,695 | $757,158 | $302,863 | $454,295 |
| 2024 | $8,695 | $742,313 | $296,925 | $445,388 |
| 2023 | $8,695 | $727,758 | $291,103 | $436,655 |
| 2022 | $8,027 | $713,490 | $285,396 | $428,094 |
| 2021 | $7,867 | $699,500 | $279,800 | $419,700 |
| 2020 | $7,838 | $692,328 | $276,931 | $415,397 |
| 2019 | $7,766 | $678,753 | $271,501 | $407,252 |
| 2018 | $7,720 | $665,445 | $266,178 | $399,267 |
| 2017 | $7,579 | $652,398 | $260,959 | $391,439 |
| 2016 | $7,586 | $639,607 | $255,843 | $383,764 |
| 2015 | $3,001 | $257,468 | $103,817 | $153,651 |
| 2014 | $2,891 | $252,426 | $101,784 | $150,642 |
Source: Public Records
Map
Nearby Homes
- 5209 San Luis Ave
- 66 Coronado Cir
- 537 Emerald Park Ct
- 61 Coronado Cir
- 29 Coronado Cir
- 31 Springhill Ct
- 28 Springhill Ct
- 71 Oakcreek Ct
- 48 Shadyleaf Ct
- 305 Simone Place N
- 52 Oakstone Ct Unit 52
- 5243 Beaumont Way
- 164 Brookview Ct
- 5518 Marit Dr
- 103 Glenoak Ct
- 311 Algiers Ct
- 5015 Charmian Dr
- 5086 Charmian Dr
- 184 El Encanto Way
- 5534 Rainbow Cir
- 5263 San Luis Ave
- 5289 San Luis Ave
- 651 Montclair Dr
- 655 Montclair Dr
- 647 Montclair Dr
- 5280 San Luis Ave
- 5241 San Luis Ave
- 5301 San Luis Ave
- 659 Montclair Dr
- 643 Montclair Dr
- 557 San Juan St
- 5233 San Luis Ave
- 5305 San Luis Ave
- 663 Montclair Dr
- 639 Montclair Dr
- 5304 San Luis Ave
- 539 San Juan St
- 4 San Luis Place
- 656 Montclair Dr