Estimated Value: $366,000 - $414,000
3
Beds
2
Baths
1,336
Sq Ft
$293/Sq Ft
Est. Value
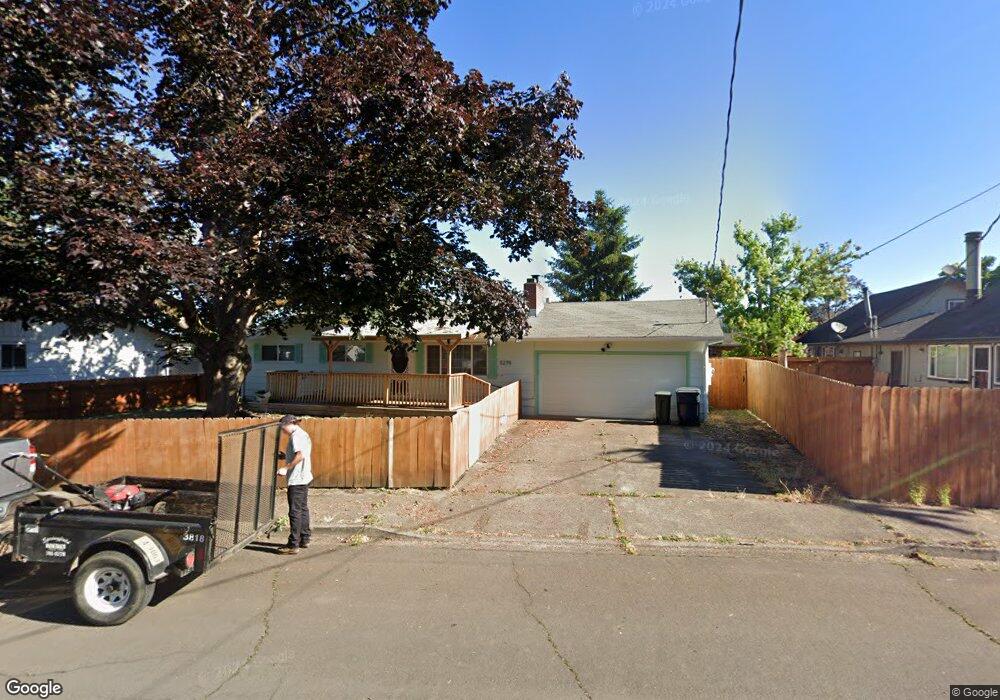
About This Home
This home is located at 5278 E St, Springfield, OR 97478 and is currently estimated at $390,903, approximately $292 per square foot. 5278 E St is a home located in Lane County with nearby schools including Riverbend Elementary School, Agnes Stewart Middle School, and Thurston High School.
Ownership History
Date
Name
Owned For
Owner Type
Purchase Details
Closed on
Nov 27, 2013
Sold by
Fischnaller Eric C and Fischnaller Christie A
Bought by
Doran Sandra L
Current Estimated Value
Purchase Details
Closed on
Oct 6, 2003
Sold by
Walker Candy Lynn
Bought by
Fischnaller Eric C and Fischnaller Christie A
Home Financials for this Owner
Home Financials are based on the most recent Mortgage that was taken out on this home.
Original Mortgage
$111,920
Interest Rate
6.27%
Mortgage Type
Purchase Money Mortgage
Purchase Details
Closed on
Dec 9, 1999
Sold by
Dane Marvin H and Jo Penny
Bought by
Walker Candy Lynn
Home Financials for this Owner
Home Financials are based on the most recent Mortgage that was taken out on this home.
Original Mortgage
$98,500
Interest Rate
10.3%
Create a Home Valuation Report for This Property
The Home Valuation Report is an in-depth analysis detailing your home's value as well as a comparison with similar homes in the area
Home Values in the Area
Average Home Value in this Area
Purchase History
| Date | Buyer | Sale Price | Title Company |
|---|---|---|---|
| Doran Sandra L | $169,000 | Western Title & Escrow | |
| Fischnaller Eric C | $139,900 | American Title Group | |
| Walker Candy Lynn | $122,900 | Western Title & Escrow Compa |
Source: Public Records
Mortgage History
| Date | Status | Borrower | Loan Amount |
|---|---|---|---|
| Previous Owner | Fischnaller Eric C | $111,920 | |
| Previous Owner | Walker Candy Lynn | $98,500 | |
| Closed | Walker Candy Lynn | $24,400 |
Source: Public Records
Tax History
| Year | Tax Paid | Tax Assessment Tax Assessment Total Assessment is a certain percentage of the fair market value that is determined by local assessors to be the total taxable value of land and additions on the property. | Land | Improvement |
|---|---|---|---|---|
| 2025 | $3,492 | $190,456 | -- | -- |
| 2024 | $3,436 | $184,909 | -- | -- |
| 2023 | $3,436 | $179,524 | $0 | $0 |
| 2022 | $3,182 | $174,296 | $0 | $0 |
| 2021 | $3,125 | $169,220 | $0 | $0 |
| 2020 | $3,034 | $164,292 | $0 | $0 |
| 2019 | $2,943 | $159,507 | $0 | $0 |
| 2018 | $2,774 | $150,351 | $0 | $0 |
| 2017 | $2,667 | $150,351 | $0 | $0 |
| 2016 | $2,611 | $145,972 | $0 | $0 |
| 2015 | $2,537 | $141,720 | $0 | $0 |
| 2014 | $2,499 | $137,592 | $0 | $0 |
Source: Public Records
Map
Nearby Homes
- 733 54th St
- 775 54th St
- 340 54th St
- 5524 E St
- 5570 B St
- 5495 A Units 69 70 71 72 St
- 205 S 54th (#11) St Unit 11
- 676 58th St
- 5736 A St
- 205 S 54th St
- 0 N St
- 5335 Main St Unit 236
- 5335 Main St
- 5335 Main St Unit 184
- 5335 Main St Unit 197
- 5335 Main St Unit 7
- 5335 Main St Unit 154
- 5335 Main St Unit 187
- 503 S 51st Place
- 422 S 49th Place
Your Personal Tour Guide
Ask me questions while you tour the home.