528 18th St Richmond, CA 94801
Belding Woods NeighborhoodEstimated Value: $298,000 - $451,433
2
Beds
1
Bath
821
Sq Ft
$492/Sq Ft
Est. Value
About This Home
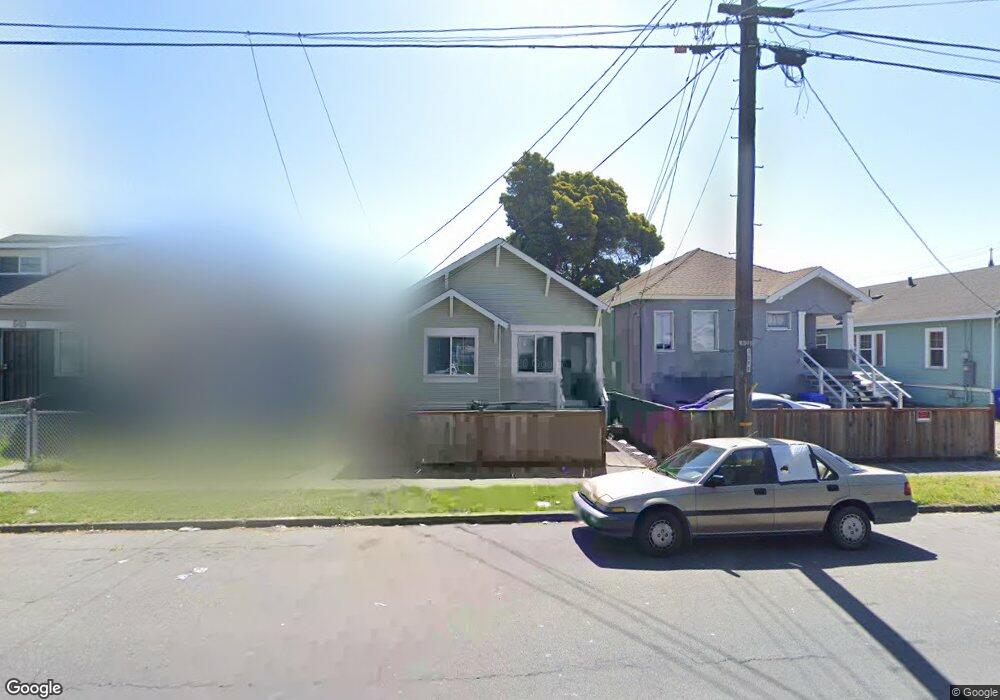
This home is located at 528 18th St, Richmond, CA 94801 and is currently estimated at $404,108, approximately $492 per square foot. 528 18th St is a home located in Contra Costa County with nearby schools including Grant Elementary School, Lovonya DeJean Middle School, and John F. Kennedy High School.
Ownership History
Date
Name
Owned For
Owner Type
Purchase Details
Closed on
Jul 29, 2014
Sold by
Tdg Investment Llc
Bought by
Davis Leavelle P
Current Estimated Value
Home Financials for this Owner
Home Financials are based on the most recent Mortgage that was taken out on this home.
Original Mortgage
$201,286
Outstanding Balance
$153,595
Interest Rate
4.13%
Mortgage Type
FHA
Estimated Equity
$250,513
Purchase Details
Closed on
Dec 2, 2013
Sold by
Wayfer George C and Wayfer Marian C
Bought by
Tdg Investments Llc
Home Financials for this Owner
Home Financials are based on the most recent Mortgage that was taken out on this home.
Original Mortgage
$114,750
Interest Rate
4.08%
Mortgage Type
New Conventional
Purchase Details
Closed on
Jun 28, 1999
Sold by
Wayfer and Marian
Bought by
Wayfer George C and Wayfer Marian C
Create a Home Valuation Report for This Property
The Home Valuation Report is an in-depth analysis detailing your home's value as well as a comparison with similar homes in the area
Home Values in the Area
Average Home Value in this Area
Purchase History
| Date | Buyer | Sale Price | Title Company |
|---|---|---|---|
| Davis Leavelle P | $205,000 | North American Title Co Inc | |
| Tdg Investments Llc | $135,000 | North American Title Company | |
| Wayfer George C | -- | -- | |
| Wayfer George C | -- | -- |
Source: Public Records
Mortgage History
| Date | Status | Borrower | Loan Amount |
|---|---|---|---|
| Open | Davis Leavelle P | $201,286 | |
| Previous Owner | Tdg Investments Llc | $114,750 |
Source: Public Records
Tax History Compared to Growth
Tax History
| Year | Tax Paid | Tax Assessment Tax Assessment Total Assessment is a certain percentage of the fair market value that is determined by local assessors to be the total taxable value of land and additions on the property. | Land | Improvement |
|---|---|---|---|---|
| 2025 | $5,492 | $246,367 | $132,199 | $114,168 |
| 2024 | $5,088 | $241,537 | $129,607 | $111,930 |
| 2023 | $5,088 | $236,802 | $127,066 | $109,736 |
| 2022 | $4,627 | $232,160 | $124,575 | $107,585 |
| 2021 | $4,552 | $227,609 | $122,133 | $105,476 |
| 2019 | $4,266 | $220,860 | $118,511 | $102,349 |
| 2018 | $4,109 | $216,531 | $116,188 | $100,343 |
| 2017 | $4,002 | $212,286 | $113,910 | $98,376 |
| 2016 | $3,927 | $208,125 | $111,677 | $96,448 |
| 2015 | $3,887 | $205,000 | $110,000 | $95,000 |
| 2014 | $2,991 | $135,000 | $95,000 | $40,000 |
Source: Public Records
Map
Nearby Homes
- 1827 Barrett Ave
- 569 18th St
- 653 20th St
- 1411 Nevin Plaza
- 649 23rd St
- 630 12th St
- 228 15th St
- 227 15th St
- 640 11th St
- 146 19th St
- 2031 Chanslor Ave
- 2555 Barrett Ave
- 1532 Chanslor Ave
- 1532 Chanslor Ave Unit T
- 1532 Chanslor Ave
- 2366 Gaynor Ave
- 1929 Lincoln Ave
- 641 9th St
- 600 26th St Unit 606
- 0 Broadway