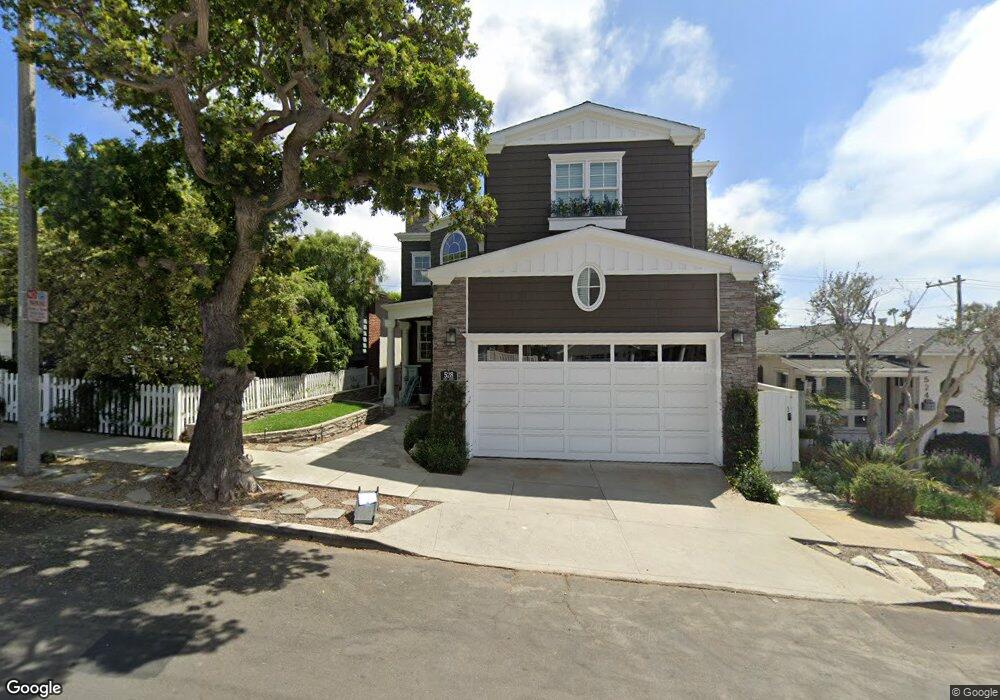
528 1st St Manhattan Beach, CA 90266
Estimated Value: $3,588,000 - $4,696,000
5
Beds
5
Baths
5,013
Sq Ft
$839/Sq Ft
Est. Value
About This Home
This home is located at 528 1st St, Manhattan Beach, CA 90266 and is currently estimated at $4,206,333, approximately $839 per square foot. 528 1st St is a home located in Los Angeles County with nearby schools including Opal Robinson Elementary School, Manhattan Beach Middle School, and Mira Costa High School.
Ownership History
Date
Name
Owned For
Owner Type
Purchase Details
Closed on
Jul 29, 2025
Sold by
Michael And Jill Scott Revocable Trust and Scott Michael A
Bought by
Michael And Jill Scott Revocable Trust and Scott
Current Estimated Value
Purchase Details
Closed on
Oct 17, 1997
Sold by
Shaul Joyce A and Shaul John B
Bought by
Scott Michael A and Scott Jill J
Home Financials for this Owner
Home Financials are based on the most recent Mortgage that was taken out on this home.
Original Mortgage
$462,400
Interest Rate
7.31%
Create a Home Valuation Report for This Property
The Home Valuation Report is an in-depth analysis detailing your home's value as well as a comparison with similar homes in the area
Home Values in the Area
Average Home Value in this Area
Purchase History
| Date | Buyer | Sale Price | Title Company |
|---|---|---|---|
| Michael And Jill Scott Revocable Trust | -- | None Listed On Document | |
| Scott Michael A | $578,000 | Southland Title Corporation | |
| Shaul John B | -- | Southland Title Corporation |
Source: Public Records
Mortgage History
| Date | Status | Borrower | Loan Amount |
|---|---|---|---|
| Previous Owner | Scott Michael A | $462,400 |
Source: Public Records
Tax History
| Year | Tax Paid | Tax Assessment Tax Assessment Total Assessment is a certain percentage of the fair market value that is determined by local assessors to be the total taxable value of land and additions on the property. | Land | Improvement |
|---|---|---|---|---|
| 2025 | $18,597 | $1,637,922 | $683,403 | $954,519 |
| 2024 | $18,597 | $1,605,806 | $670,003 | $935,803 |
| 2023 | $18,300 | $1,574,320 | $656,866 | $917,454 |
| 2022 | $17,987 | $1,543,452 | $643,987 | $899,465 |
| 2021 | $17,673 | $1,513,189 | $631,360 | $881,829 |
| 2019 | $17,204 | $1,468,309 | $612,635 | $855,674 |
| 2018 | $16,841 | $1,439,520 | $600,623 | $838,897 |
| 2016 | $15,574 | $1,383,624 | $577,301 | $806,323 |
| 2015 | $15,254 | $1,362,842 | $568,630 | $794,212 |
| 2014 | $15,045 | $1,336,147 | $557,492 | $778,655 |
Source: Public Records
Map
Nearby Homes
- 207 S Poinsettia Ave
- 215 S Poinsettia Ave
- 541 4th St
- 98 Highland Ave
- 934 1st St
- 626 Longfellow Ave
- 2919 Hermosa View Dr
- 89 Bayview Dr
- 231 Longfellow Ave
- 213 Bayview Dr
- 212 Manhattan Ave
- 2900 Hermosa View Dr
- 2965 La Carlita St
- 229 7th St
- 927 9th St
- 649 Gould Terrace
- 2526 Hermosa Ave
- 920 The Strand
- 124 11th St
- 525 Manhattan Beach Blvd
Your Personal Tour Guide
Ask me questions while you tour the home.