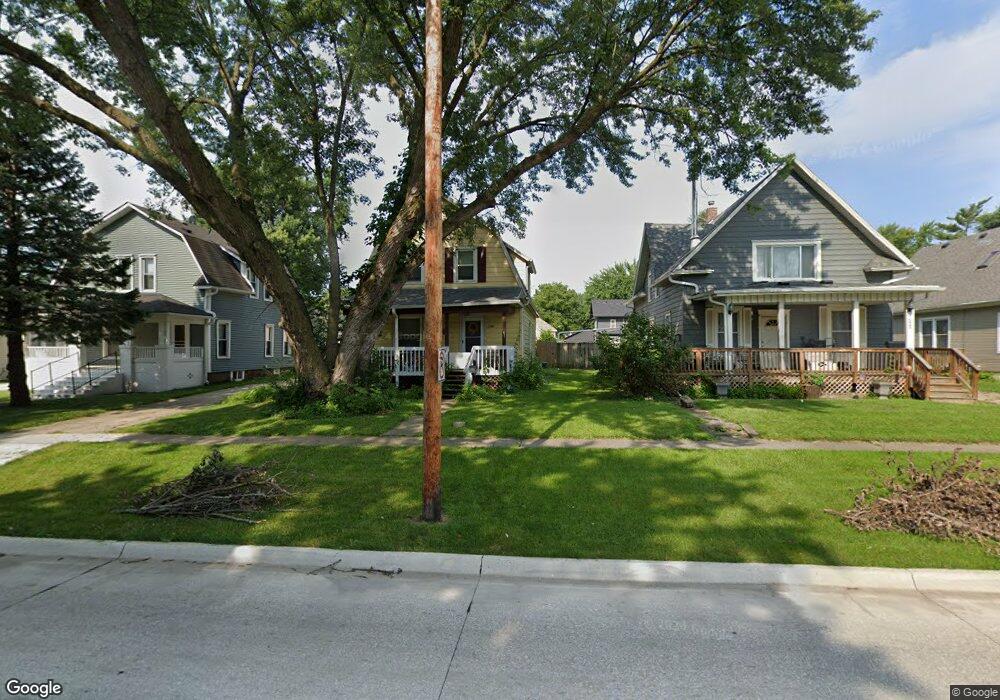
528 8th St West Des Moines, IA 50265
Estimated Value: $234,000 - $260,000
4
Beds
1
Bath
1,497
Sq Ft
$163/Sq Ft
Est. Value
About This Home
This home is located at 528 8th St, West Des Moines, IA 50265 and is currently estimated at $244,307, approximately $163 per square foot. 528 8th St is a home located in Polk County with nearby schools including Hillside Elementary School, Stilwell Junior High School, and Valley Southwoods Freshman High School.
Ownership History
Date
Name
Owned For
Owner Type
Purchase Details
Closed on
Mar 10, 2009
Sold by
Jp Morgan Chase Bank National Associatio
Bought by
Fidler Susan M
Current Estimated Value
Home Financials for this Owner
Home Financials are based on the most recent Mortgage that was taken out on this home.
Original Mortgage
$60,760
Outstanding Balance
$38,592
Interest Rate
5.19%
Mortgage Type
Purchase Money Mortgage
Estimated Equity
$205,715
Purchase Details
Closed on
Sep 18, 2008
Sold by
Bright Casey Richard and Bright Magdalena C
Bought by
Washington Mutual Bank and Long Beach Mortgage Co
Purchase Details
Closed on
Jun 12, 2000
Sold by
Mccain Dan and Mccain Melissa
Bought by
Bright Casey Richard and Mcginn Magdalena C
Home Financials for this Owner
Home Financials are based on the most recent Mortgage that was taken out on this home.
Original Mortgage
$62,550
Interest Rate
8.56%
Create a Home Valuation Report for This Property
The Home Valuation Report is an in-depth analysis detailing your home's value as well as a comparison with similar homes in the area
Home Values in the Area
Average Home Value in this Area
Purchase History
| Date | Buyer | Sale Price | Title Company |
|---|---|---|---|
| Fidler Susan M | $61,500 | Itc | |
| Jpmorgan Chase Bank National Association | -- | None Available | |
| Washington Mutual Bank | $52,000 | None Available | |
| Bright Casey Richard | $64,000 | -- |
Source: Public Records
Mortgage History
| Date | Status | Borrower | Loan Amount |
|---|---|---|---|
| Open | Fidler Susan M | $60,760 | |
| Previous Owner | Bright Casey Richard | $62,550 |
Source: Public Records
Tax History Compared to Growth
Tax History
| Year | Tax Paid | Tax Assessment Tax Assessment Total Assessment is a certain percentage of the fair market value that is determined by local assessors to be the total taxable value of land and additions on the property. | Land | Improvement |
|---|---|---|---|---|
| 2025 | $2,986 | $213,600 | $45,600 | $168,000 |
| 2024 | $2,986 | $198,800 | $42,300 | $156,500 |
| 2023 | $2,762 | $198,800 | $42,300 | $156,500 |
| 2022 | $2,728 | $151,900 | $34,000 | $117,900 |
| 2021 | $2,566 | $151,900 | $34,000 | $117,900 |
| 2020 | $2,522 | $136,500 | $30,700 | $105,800 |
| 2019 | $2,328 | $136,500 | $30,700 | $105,800 |
| 2018 | $2,330 | $122,200 | $27,200 | $95,000 |
| 2017 | $2,244 | $122,200 | $27,200 | $95,000 |
| 2016 | $2,192 | $114,700 | $25,400 | $89,300 |
| 2015 | $2,192 | $114,700 | $25,400 | $89,300 |
| 2014 | $2,154 | $111,700 | $24,400 | $87,300 |
Source: Public Records
Map
Nearby Homes