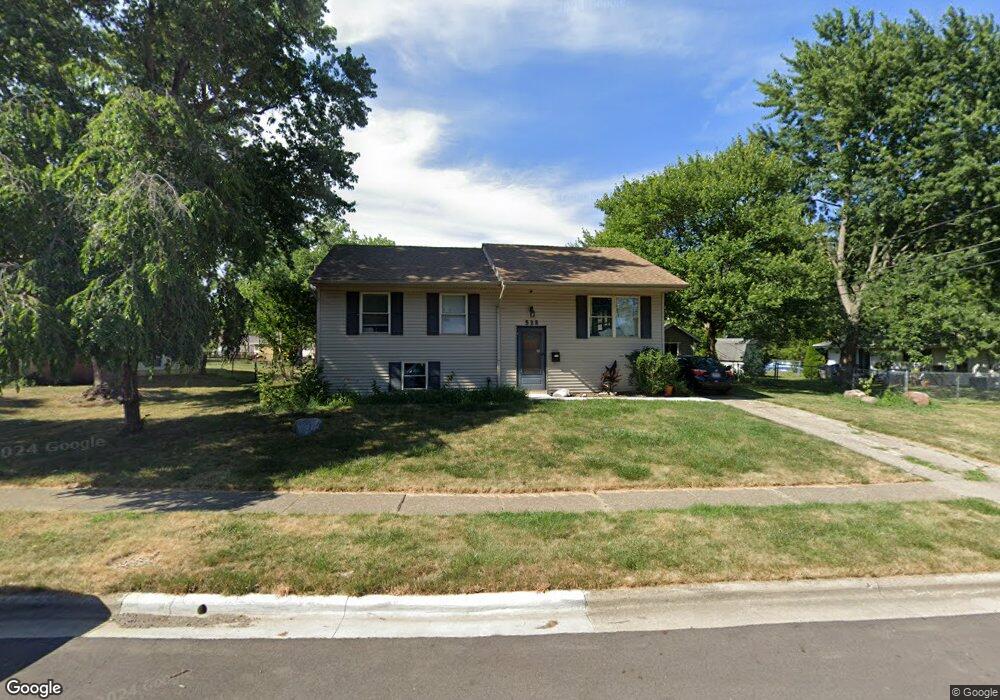
528 Bonnington Way Columbus, OH 43230
Estimated Value: $239,000 - $287,000
4
Beds
2
Baths
1,447
Sq Ft
$187/Sq Ft
Est. Value
About This Home
This home is located at 528 Bonnington Way, Columbus, OH 43230 and is currently estimated at $271,122, approximately $187 per square foot. 528 Bonnington Way is a home located in Franklin County with nearby schools including Royal Manor Elementary School, Gahanna West Middle School, and Lincoln High School.
Ownership History
Date
Name
Owned For
Owner Type
Purchase Details
Closed on
Jun 10, 2017
Sold by
Jpmorgan Chase Bank Na
Bought by
Kmm Properties Llc
Current Estimated Value
Purchase Details
Closed on
Mar 17, 2017
Sold by
Count Christopher D and Count Christopher D
Bought by
Jpmorgan Chase Bank Na
Purchase Details
Closed on
Dec 2, 2005
Sold by
Counts Christopher D
Bought by
Mcclary Jessica L
Purchase Details
Closed on
Jul 8, 2005
Sold by
Allen Julie M
Bought by
Counts Christopher D
Home Financials for this Owner
Home Financials are based on the most recent Mortgage that was taken out on this home.
Original Mortgage
$133,929
Interest Rate
5.68%
Mortgage Type
FHA
Purchase Details
Closed on
Aug 30, 2002
Sold by
Kenimer Seth and Kenimer Tricia M
Bought by
Allen Julie M
Home Financials for this Owner
Home Financials are based on the most recent Mortgage that was taken out on this home.
Original Mortgage
$92,800
Interest Rate
6.54%
Mortgage Type
Purchase Money Mortgage
Purchase Details
Closed on
Mar 3, 1992
Purchase Details
Closed on
Jun 5, 1990
Create a Home Valuation Report for This Property
The Home Valuation Report is an in-depth analysis detailing your home's value as well as a comparison with similar homes in the area
Home Values in the Area
Average Home Value in this Area
Purchase History
| Date | Buyer | Sale Price | Title Company |
|---|---|---|---|
| Kmm Properties Llc | $110,300 | Landcastle Title Llc | |
| Jpmorgan Chase Bank Na | $95,000 | None Available | |
| Mcclary Jessica L | -- | -- | |
| Counts Christopher D | $135,000 | Lawyers Tit | |
| Allen Julie M | $118,000 | Gahanna Title | |
| -- | -- | -- | |
| -- | $63,500 | -- |
Source: Public Records
Mortgage History
| Date | Status | Borrower | Loan Amount |
|---|---|---|---|
| Previous Owner | Counts Christopher D | $133,929 | |
| Previous Owner | Allen Julie M | $92,800 |
Source: Public Records
Tax History Compared to Growth
Tax History
| Year | Tax Paid | Tax Assessment Tax Assessment Total Assessment is a certain percentage of the fair market value that is determined by local assessors to be the total taxable value of land and additions on the property. | Land | Improvement |
|---|---|---|---|---|
| 2024 | $4,550 | $75,710 | $23,000 | $52,710 |
| 2023 | $4,494 | $75,705 | $22,995 | $52,710 |
| 2022 | $4,129 | $54,180 | $14,910 | $39,270 |
| 2021 | $3,996 | $54,180 | $14,910 | $39,270 |
| 2020 | $3,965 | $54,180 | $14,910 | $39,270 |
| 2019 | $3,291 | $44,740 | $12,430 | $32,310 |
| 2018 | $3,158 | $44,740 | $12,430 | $32,310 |
| 2017 | $2,947 | $44,740 | $12,430 | $32,310 |
| 2016 | $3,044 | $42,080 | $11,100 | $30,980 |
| 2015 | $3,046 | $42,080 | $11,100 | $30,980 |
| 2014 | $3,022 | $42,080 | $11,100 | $30,980 |
| 2013 | $1,501 | $42,070 | $11,095 | $30,975 |
Source: Public Records
Map
Nearby Homes
- 278 Empire Dr
- 209 Imperial Dr
- 343 Imperial Dr
- 221 Lincolnshire Rd
- 600 Agler Rd
- 404 Foxwood Dr
- 470 Deerwood Ave E
- 463 Lincolnshire Rd
- 464 Foxwood Dr
- 668 Kenilworth Ct
- 3610 N Stygler Rd
- 2741 Acarie Dr
- 3888 Agler Rd
- 4093 Adalric Dr
- 4131 Claver Dr
- 2694 Kantian Dr
- 2851 Acarie Dr
- 3784 Armuth Ave
- 0 Mifflin Blvd
- 0 E Minnesota Ave Unit 224018641
- 538 Bonnington Way
- 241 Empire Dr
- 253 Empire Dr
- 259 Empire Dr
- 544 Bonnington Way
- 531 Bonnington Way
- 519 Bonnington Way
- 537 Bonnington Way
- 263 Empire Dr
- 543 Bonnington Way
- 548 Bonnington Way
- 547 Bonnington Way
- 217 Empire Dr
- 269 Empire Dr
- 254 Empire Dr
- 242 Empire Dr
- 260 Empire Dr
- 248 Empire Dr
- 236 Empire Dr
- 552 Bonnington Way