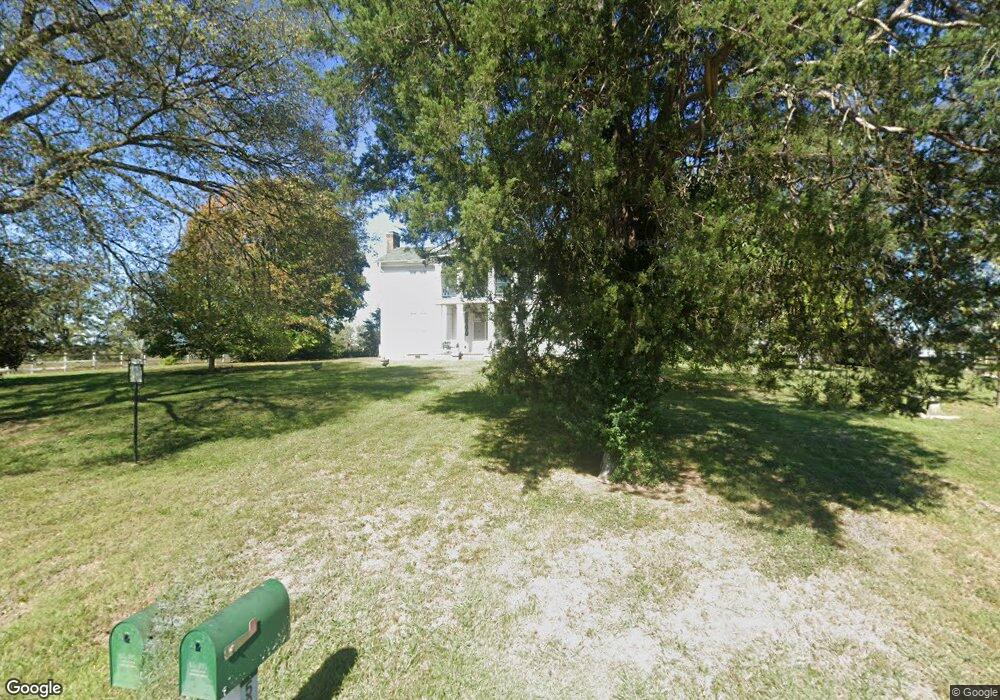
528 Charlie Russell Rd Shelbyville, TN 37160
Estimated Value: $623,193 - $888,000
--
Bed
2
Baths
3,425
Sq Ft
$210/Sq Ft
Est. Value
About This Home
This home is located at 528 Charlie Russell Rd, Shelbyville, TN 37160 and is currently estimated at $717,798, approximately $209 per square foot. 528 Charlie Russell Rd is a home located in Bedford County with nearby schools including Liberty Elementary School.
Ownership History
Date
Name
Owned For
Owner Type
Purchase Details
Closed on
Oct 31, 2014
Sold by
Russell Alice L
Bought by
Barritt James
Current Estimated Value
Purchase Details
Closed on
May 28, 2008
Sold by
Russell William L
Bought by
Barritt James S
Purchase Details
Closed on
Aug 3, 2006
Sold by
Russell William L
Bought by
Zamora George
Purchase Details
Closed on
Oct 4, 1999
Sold by
White Marianna B
Bought by
Russell William L and Russell Alice
Home Financials for this Owner
Home Financials are based on the most recent Mortgage that was taken out on this home.
Original Mortgage
$435,272
Interest Rate
7.85%
Purchase Details
Closed on
May 20, 1999
Sold by
Goodrich Carolyn
Bought by
White Marianna B
Purchase Details
Closed on
Feb 16, 1979
Bought by
Goodrich Carolyn and White Mariana B
Purchase Details
Closed on
May 19, 1973
Create a Home Valuation Report for This Property
The Home Valuation Report is an in-depth analysis detailing your home's value as well as a comparison with similar homes in the area
Home Values in the Area
Average Home Value in this Area
Purchase History
| Date | Buyer | Sale Price | Title Company |
|---|---|---|---|
| Barritt James | -- | -- | |
| Barritt James S | $565,750 | -- | |
| Zamora George | $223,090 | -- | |
| Russell William L | $430,000 | -- | |
| White Marianna B | $8,412 | -- | |
| Goodrich Carolyn | -- | -- | |
| -- | -- | -- |
Source: Public Records
Mortgage History
| Date | Status | Borrower | Loan Amount |
|---|---|---|---|
| Previous Owner | Not Available | $435,272 |
Source: Public Records
Tax History Compared to Growth
Tax History
| Year | Tax Paid | Tax Assessment Tax Assessment Total Assessment is a certain percentage of the fair market value that is determined by local assessors to be the total taxable value of land and additions on the property. | Land | Improvement |
|---|---|---|---|---|
| 2025 | $2,542 | $109,325 | $0 | $0 |
| 2024 | $2,542 | $109,325 | $14,025 | $95,300 |
| 2023 | $2,542 | $109,325 | $14,025 | $95,300 |
| 2022 | $2,542 | $109,325 | $14,025 | $95,300 |
| 2021 | $2,148 | $109,325 | $14,025 | $95,300 |
| 2020 | $1,815 | $109,325 | $14,025 | $95,300 |
| 2019 | $1,815 | $68,250 | $10,925 | $57,325 |
| 2018 | $1,747 | $68,250 | $10,925 | $57,325 |
| 2017 | $1,747 | $68,250 | $10,925 | $57,325 |
| 2014 | $1,464 | $64,496 | $0 | $0 |
Source: Public Records
Map
Nearby Homes
- 1617 Highway 130 W
- 0 Adams Hollow Rd
- 7 Dixon Rd
- 12 Dixon Rd
- 2131 Highway 130 W
- 8 Farris Ln
- 321 Dixon Rd
- 0 Knight Campground Rd
- 3 Knight Campground Rd
- 3544 U S 231
- 0 Dixon Rd Unit RTC3045417
- 1261 Highway 130 W
- 1157 Mount Herman Rd
- 506 New Center Church Rd
- 349 Naron Rd
- 1399 Goose Creek Rd
- 485 Naron Rd
- 1106 Highway 130 W
- 112 August Way
- 0 New Center Church Rd
- 528 Charlie Russell Rd
- 410 Charlie Russell Rd
- 533 Charlie Russell Rd
- 383 Charlie Russell Rd
- 500 Charlie Russell Rd
- 7 Charlie Russell Rd
- 10 Charlie Russell Rd
- 200 Huffman Ln
- 312 Charlie Russell Rd
- 272 Charlie Russell Rd
- 361 Robinson Rd
- 2620 Highway 231 S
- 338 Robinson Rd
- 357 Robinson Rd
- 276 Robinson Rd
- 337 Robinson Rd
- 175 Huffman Ln
- 357 Sandusky Rd
- 19 Huffman Ln
- 311 Robinson Rd