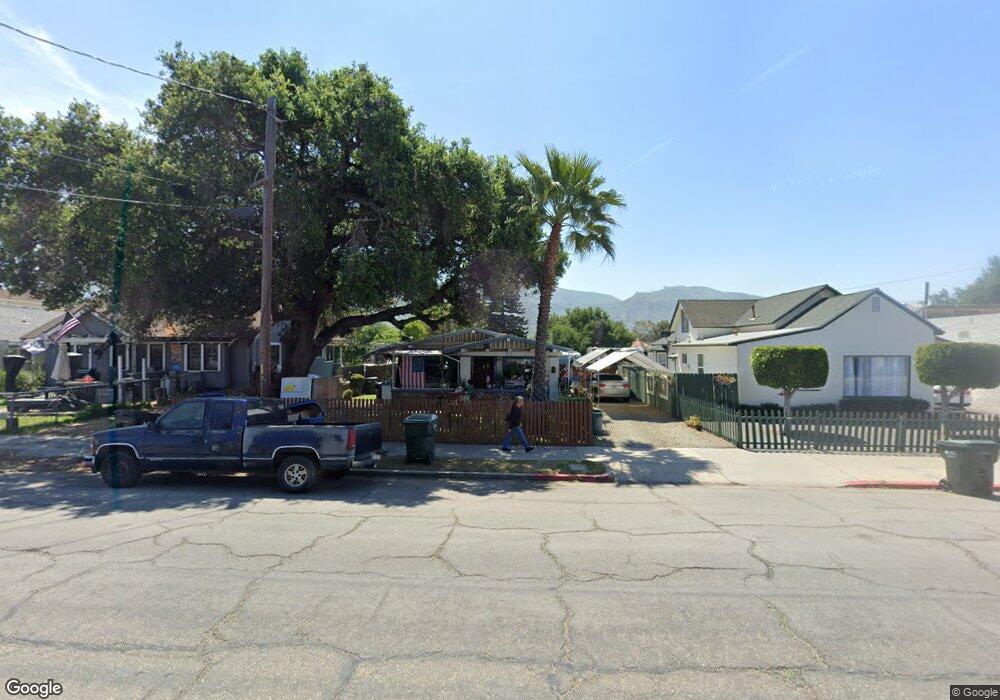
528 E Main St Santa Paula, CA 93060
Estimated Value: $479,000 - $649,000
2
Beds
1
Bath
1,017
Sq Ft
$572/Sq Ft
Est. Value
About This Home
This home is located at 528 E Main St, Santa Paula, CA 93060 and is currently estimated at $582,140, approximately $572 per square foot. 528 E Main St is a home located in Ventura County with nearby schools including Glen City Elementary School, Isbell Middle, and Santa Paula High.
Ownership History
Date
Name
Owned For
Owner Type
Purchase Details
Closed on
Sep 3, 2021
Sold by
Campbell Fultz Robert
Bought by
Robert And Jane Fultz Family Trust
Current Estimated Value
Purchase Details
Closed on
Jul 1, 2021
Sold by
Pina Carole F and Wa Carole J
Bought by
Eaton Alice F and The Alice Eaton Living Trust
Purchase Details
Closed on
Oct 24, 2008
Sold by
Eaton Alice F and Eaton Alice I
Bought by
Eaton Alice F
Purchase Details
Closed on
Jul 31, 2008
Sold by
Fultz Robert C and Fultz Jane K
Bought by
Fultz Robert C and Fultz Jane K
Purchase Details
Closed on
Jul 2, 2008
Sold by
Mcclung Katherine Mary Eaton and Eaton Mary Katherine
Bought by
Mcclung Katherine Mary Eaton
Purchase Details
Closed on
Jun 27, 2008
Sold by
Fultz Robert C and Fultz Jane F
Bought by
Eaton Alice I and Pina Carole J Fultz
Create a Home Valuation Report for This Property
The Home Valuation Report is an in-depth analysis detailing your home's value as well as a comparison with similar homes in the area
Home Values in the Area
Average Home Value in this Area
Purchase History
| Date | Buyer | Sale Price | Title Company |
|---|---|---|---|
| Robert And Jane Fultz Family Trust | -- | -- | |
| Eaton Alice F | -- | Fidelity National Title | |
| Mcclung Katherine Mary Eaton | -- | Fidelity National Title | |
| Robert And Jane Fultz Family Trust | -- | -- | |
| Eaton Alice F | -- | None Available | |
| Fultz Robert C | -- | None Available | |
| Mcclung Katherine Mary Eaton | -- | None Available | |
| Eaton Alice I | -- | None Available | |
| Eaton Alice F | -- | None Available | |
| Eaton Alice I | -- | None Available |
Source: Public Records
Tax History
| Year | Tax Paid | Tax Assessment Tax Assessment Total Assessment is a certain percentage of the fair market value that is determined by local assessors to be the total taxable value of land and additions on the property. | Land | Improvement |
|---|---|---|---|---|
| 2025 | $3,884 | $336,557 | $191,328 | $145,229 |
| 2024 | $3,884 | $329,958 | $187,576 | $142,382 |
| 2023 | $3,804 | $323,489 | $183,898 | $139,591 |
| 2022 | $3,696 | $317,147 | $180,293 | $136,854 |
| 2021 | $2,559 | $213,671 | $103,137 | $110,534 |
| 2020 | $2,547 | $211,482 | $102,081 | $109,401 |
| 2019 | $2,410 | $207,336 | $100,080 | $107,256 |
| 2018 | $2,380 | $203,271 | $98,118 | $105,153 |
| 2017 | $2,407 | $199,287 | $96,195 | $103,092 |
| 2016 | $2,265 | $195,380 | $94,309 | $101,071 |
| 2015 | $2,167 | $192,447 | $92,894 | $99,553 |
| 2014 | $2,201 | $188,678 | $91,075 | $97,603 |
Source: Public Records
Map
Nearby Homes
- 336 E Harvard Blvd
- 738 E Santa Paula St
- 129 E Ventura St Unit A
- 102 E Ventura St Unit A
- 340 Campbell Ct
- 420 Snowdrop Ln
- 114 E Ventura St Unit H
- 417 N 8th St
- 180 E Pleasant St
- 933 E Santa Paula St
- 573 Eureka Dr
- 2025 Oreste Ln
- 2046 Oreste Ln
- 2037 Oreste Ln
- 2040 Pyrenes Place
- 2041 Oreste Ln
- 2018 Pyrenes Place
- 2019 Pyrenes Place
- 2028 Pyrenes Place
- 587 Eureka Dr
Your Personal Tour Guide
Ask me questions while you tour the home.