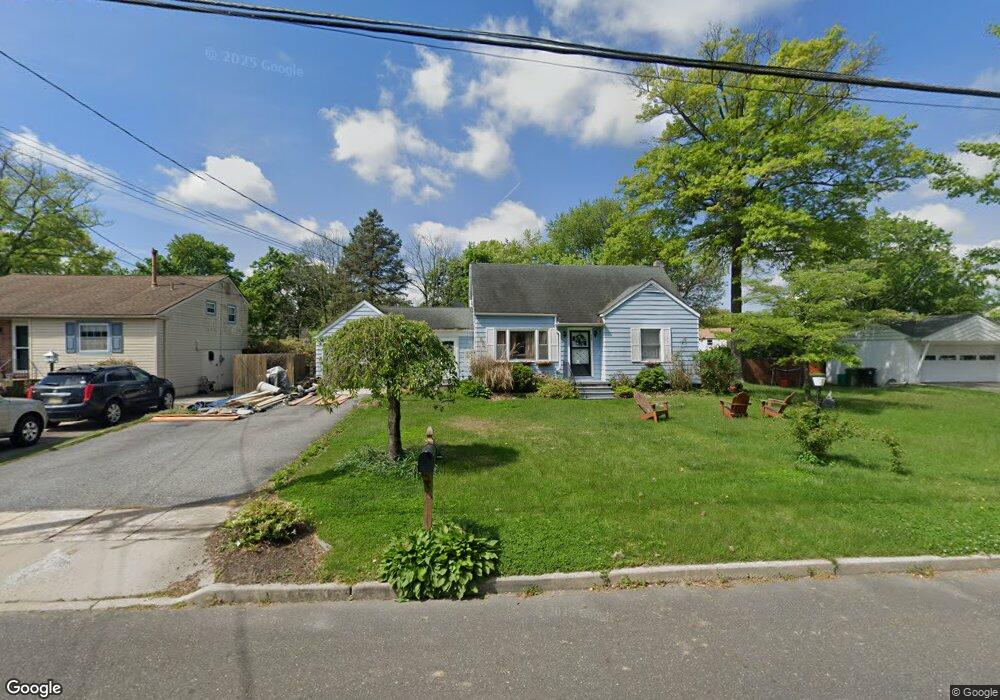
528 Elm Ave Pitman, NJ 08071
Estimated Value: $345,307 - $405,000
--
Bed
--
Bath
1,584
Sq Ft
$233/Sq Ft
Est. Value
About This Home
This home is located at 528 Elm Ave, Pitman, NJ 08071 and is currently estimated at $368,577, approximately $232 per square foot. 528 Elm Ave is a home located in Gloucester County with nearby schools including Memorial Elementary School, Pitman Middle School, and Pitman High School.
Ownership History
Date
Name
Owned For
Owner Type
Purchase Details
Closed on
Apr 7, 2006
Sold by
Rulon Jamie May
Bought by
Bennett Joshua Eric and Bennett Jamie Lynn
Current Estimated Value
Home Financials for this Owner
Home Financials are based on the most recent Mortgage that was taken out on this home.
Original Mortgage
$100,000
Outstanding Balance
$57,201
Interest Rate
6.28%
Mortgage Type
Purchase Money Mortgage
Estimated Equity
$311,376
Create a Home Valuation Report for This Property
The Home Valuation Report is an in-depth analysis detailing your home's value as well as a comparison with similar homes in the area
Home Values in the Area
Average Home Value in this Area
Purchase History
| Date | Buyer | Sale Price | Title Company |
|---|---|---|---|
| Bennett Joshua Eric | $125,000 | -- |
Source: Public Records
Mortgage History
| Date | Status | Borrower | Loan Amount |
|---|---|---|---|
| Open | Bennett Joshua Eric | $100,000 |
Source: Public Records
Tax History Compared to Growth
Tax History
| Year | Tax Paid | Tax Assessment Tax Assessment Total Assessment is a certain percentage of the fair market value that is determined by local assessors to be the total taxable value of land and additions on the property. | Land | Improvement |
|---|---|---|---|---|
| 2025 | $8,827 | $252,700 | $65,600 | $187,100 |
| 2024 | $8,594 | $252,700 | $65,600 | $187,100 |
| 2023 | $8,594 | $252,700 | $65,600 | $187,100 |
| 2022 | $8,256 | $252,700 | $65,600 | $187,100 |
| 2021 | $7,796 | $173,900 | $57,200 | $116,700 |
| 2020 | $7,704 | $173,900 | $57,200 | $116,700 |
| 2019 | $7,523 | $173,900 | $57,200 | $116,700 |
| 2018 | $7,396 | $173,900 | $57,200 | $116,700 |
| 2017 | $7,304 | $173,900 | $57,200 | $116,700 |
| 2016 | $7,163 | $173,900 | $57,200 | $116,700 |
| 2015 | $6,970 | $173,900 | $57,200 | $116,700 |
| 2014 | $6,756 | $173,900 | $57,200 | $116,700 |
Source: Public Records
Map
Nearby Homes