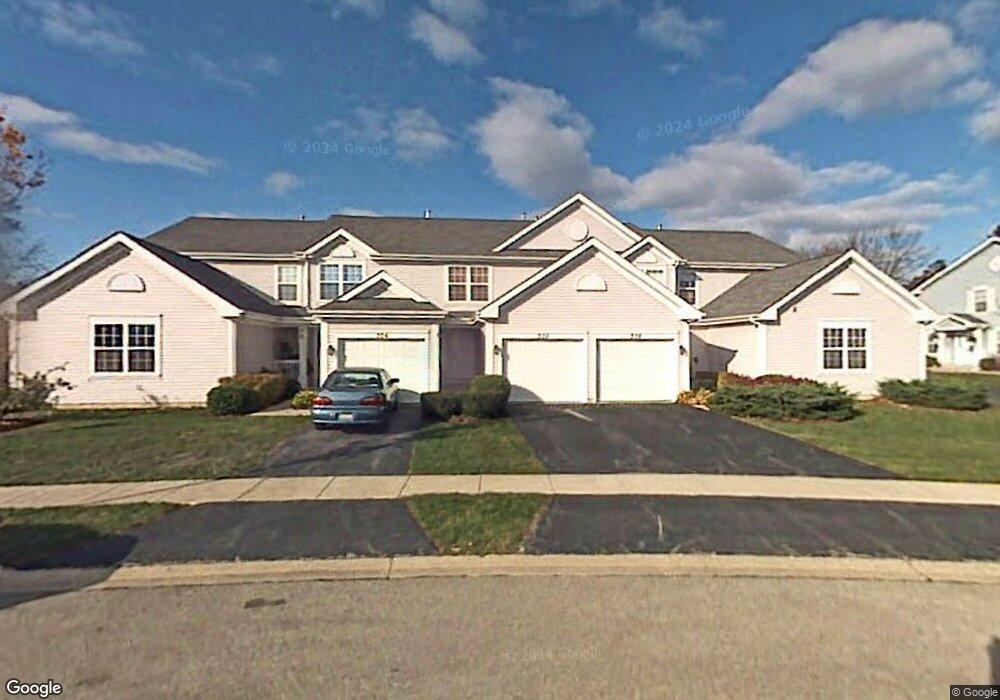
528 Jennifer Cir Unit 528 Mundelein, IL 60060
Estimated Value: $279,819 - $292,000
2
Beds
3
Baths
1,260
Sq Ft
$226/Sq Ft
Est. Value
About This Home
This home is located at 528 Jennifer Cir Unit 528, Mundelein, IL 60060 and is currently estimated at $284,205, approximately $225 per square foot. 528 Jennifer Cir Unit 528 is a home located in Lake County with nearby schools including Diamond Lake Elementary School, West Oak Middle School, and Mundelein Cons High School.
Ownership History
Date
Name
Owned For
Owner Type
Purchase Details
Closed on
Apr 28, 2017
Sold by
Lelchuk Polina
Bought by
Sitnikova Tatjana
Current Estimated Value
Home Financials for this Owner
Home Financials are based on the most recent Mortgage that was taken out on this home.
Original Mortgage
$112,500
Outstanding Balance
$92,961
Interest Rate
3.87%
Mortgage Type
New Conventional
Estimated Equity
$191,244
Purchase Details
Closed on
Feb 6, 2007
Sold by
Lelchuk Polina and Klyuchevich Tatyana
Bought by
Lelchuk Polina
Purchase Details
Closed on
Dec 15, 2004
Sold by
Lelchuk Polina
Bought by
Lechuk Polina and Klyuchevich Tatyana
Home Financials for this Owner
Home Financials are based on the most recent Mortgage that was taken out on this home.
Original Mortgage
$169,500
Interest Rate
5%
Mortgage Type
Stand Alone Refi Refinance Of Original Loan
Purchase Details
Closed on
Aug 26, 2004
Sold by
Kislyuk Naum and Kislyuk Ludmila
Bought by
Lelchyk Polina
Create a Home Valuation Report for This Property
The Home Valuation Report is an in-depth analysis detailing your home's value as well as a comparison with similar homes in the area
Home Values in the Area
Average Home Value in this Area
Purchase History
| Date | Buyer | Sale Price | Title Company |
|---|---|---|---|
| Sitnikova Tatjana | $150,000 | Proper Title Llc | |
| Lelchuk Polina | -- | None Available | |
| Lechuk Polina | -- | -- | |
| Lelchyk Polina | $188,000 | Chicago Title Co |
Source: Public Records
Mortgage History
| Date | Status | Borrower | Loan Amount |
|---|---|---|---|
| Open | Sitnikova Tatjana | $112,500 | |
| Previous Owner | Lechuk Polina | $169,500 |
Source: Public Records
Tax History Compared to Growth
Tax History
| Year | Tax Paid | Tax Assessment Tax Assessment Total Assessment is a certain percentage of the fair market value that is determined by local assessors to be the total taxable value of land and additions on the property. | Land | Improvement |
|---|---|---|---|---|
| 2024 | $5,825 | $68,253 | $14,478 | $53,775 |
| 2023 | $5,618 | $62,953 | $13,354 | $49,599 |
| 2022 | $5,618 | $58,626 | $12,833 | $45,793 |
| 2021 | $5,409 | $57,364 | $12,557 | $44,807 |
| 2020 | $5,326 | $56,400 | $12,346 | $44,054 |
| 2019 | $5,251 | $55,864 | $12,229 | $43,635 |
| 2018 | $4,084 | $45,074 | $12,203 | $32,871 |
| 2017 | $4,021 | $43,651 | $11,818 | $31,833 |
| 2016 | $3,861 | $41,387 | $11,205 | $30,182 |
| 2015 | $3,718 | $38,683 | $10,473 | $28,210 |
| 2014 | $3,234 | $35,588 | $9,772 | $25,816 |
| 2012 | $4,017 | $35,897 | $9,857 | $26,040 |
Source: Public Records
Map
Nearby Homes
- 519 Jennifer Cir Unit 111
- 1651 Pauline Cir Unit 1
- 1631 Pauline Cir Unit 3
- 18804 W Hickory St
- 18838 W Hickory St
- 1544 Lakeridge Ct
- 207 Shady Ln
- 18951 W Hickory St
- 130 Shadydell Ave
- 373 E Il Route 83
- 427 E Il Route 83
- MCKINLEY Plan at The Townes at Oak Creek
- GREGORY Plan at The Townes at Oak Creek
- GARFIELD Plan at The Townes at Oak Creek
- MONTGOMERY Plan at The Townes at Oak Creek
- 605 Acadia Ave
- 26325 N Walnut Ave
- 19330 W Lake View Ave
- 342 Allanson Rd
- 26346 N Walnut Ave
- 532 Jennifer Cir Unit 705
- 528 Jennifer Cir Unit 74
- 526 Jennifer Cir Unit 73
- 524 Jennifer Cir Unit 72
- 524 Jennifer Cir Unit 524
- 522 Jennifer Cir Unit 71
- 534 Jennifer Cir Unit 61
- 536 Jennifer Cir Unit 62
- 536 Jennifer Cir Unit 536
- 538 Jennifer Cir Unit 63
- 540 Jennifer Cir Unit 64
- 542 Jennifer Cir Unit 65
- 529 Jennifer Cir Unit 102
- 546 Jennifer Cir Unit 66
- 527 Jennifer Cir Unit 103
- 515 Jennifer Cir Unit 112
- 566 Jennifer Cir Unit 44
- 564 Jennifer Cir Unit 43
- 562 Jennifer Cir Unit 42
- 560 Jennifer Cir Unit 41