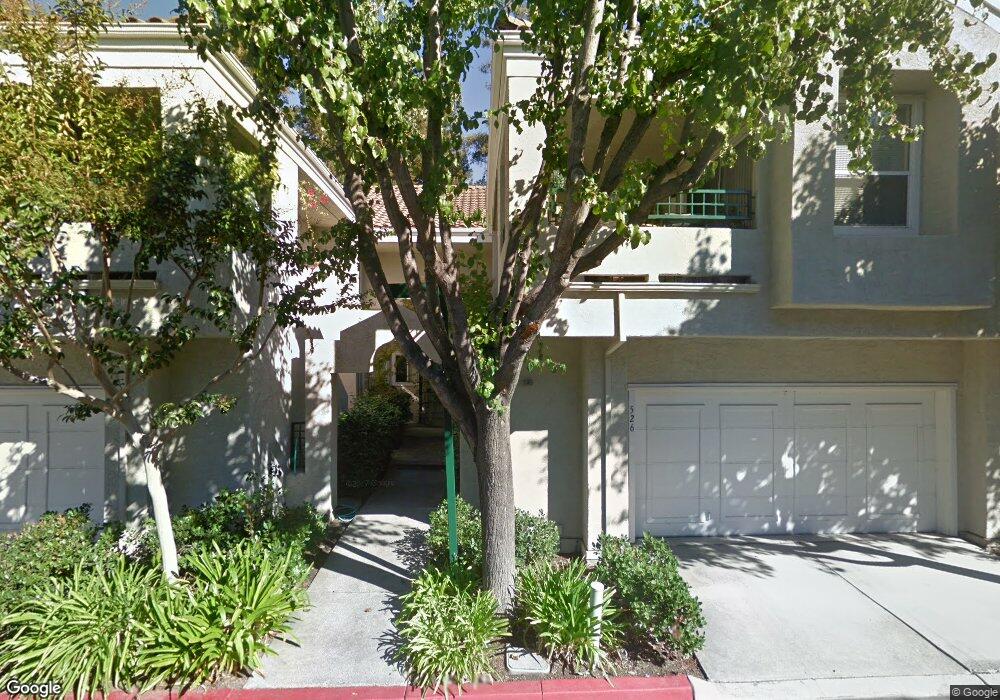
528 Quailbrook Ct Unit 7 San Jose, CA 95110
Japantown NeighborhoodEstimated Value: $636,000 - $775,000
2
Beds
2
Baths
1,019
Sq Ft
$690/Sq Ft
Est. Value
About This Home
This home is located at 528 Quailbrook Ct Unit 7, San Jose, CA 95110 and is currently estimated at $703,122, approximately $690 per square foot. 528 Quailbrook Ct Unit 7 is a home located in Santa Clara County with nearby schools including Grant Elementary School, Muwekma Ohlone Middle, and Abraham Lincoln High.
Ownership History
Date
Name
Owned For
Owner Type
Purchase Details
Closed on
Feb 16, 1995
Sold by
Obrien Steve
Bought by
Harper James T and Harper Arline C
Current Estimated Value
Home Financials for this Owner
Home Financials are based on the most recent Mortgage that was taken out on this home.
Original Mortgage
$127,000
Interest Rate
5.25%
Create a Home Valuation Report for This Property
The Home Valuation Report is an in-depth analysis detailing your home's value as well as a comparison with similar homes in the area
Home Values in the Area
Average Home Value in this Area
Purchase History
| Date | Buyer | Sale Price | Title Company |
|---|---|---|---|
| Harper James T | $175,000 | American Title Insurance Co |
Source: Public Records
Mortgage History
| Date | Status | Borrower | Loan Amount |
|---|---|---|---|
| Closed | Harper James T | $127,000 |
Source: Public Records
Tax History
| Year | Tax Paid | Tax Assessment Tax Assessment Total Assessment is a certain percentage of the fair market value that is determined by local assessors to be the total taxable value of land and additions on the property. | Land | Improvement |
|---|---|---|---|---|
| 2025 | $3,970 | $293,915 | $83,967 | $209,948 |
| 2024 | $3,970 | $288,153 | $82,321 | $205,832 |
| 2023 | $3,970 | $282,504 | $80,707 | $201,797 |
| 2022 | $3,871 | $276,966 | $79,125 | $197,841 |
| 2021 | $3,791 | $271,536 | $77,574 | $193,962 |
| 2020 | $3,732 | $268,753 | $76,779 | $191,974 |
| 2019 | $3,663 | $263,484 | $75,274 | $188,210 |
| 2018 | $3,629 | $258,319 | $73,799 | $184,520 |
| 2017 | $3,600 | $253,254 | $72,352 | $180,902 |
| 2016 | $3,477 | $248,289 | $70,934 | $177,355 |
| 2015 | $3,446 | $244,560 | $69,869 | $174,691 |
| 2014 | $3,368 | $239,771 | $68,501 | $171,270 |
Source: Public Records
Map
Nearby Homes
- 173 Clayton Ave
- 175 Hobson St
- 95 Hobson St Unit 6A
- 44 Ryland Park Dr
- 0 George Blvd Unit 26000960
- 0 George Blvd Unit SR26026107
- 0 George Blvd Unit HD22141315
- 20 Ryland Park Dr Unit 309
- 400 N 1st St Unit 111
- 166 Nexus Loop
- 1 E Julian St Unit 113
- 649 N 4th St
- 651 N 4th St
- 46 W Julian St Unit 208
- 30 E Julian St Unit 208
- 30 E Julian St Unit 307
- 175 W Saint James St Unit 106
- 175 W Saint James St Unit 1303
- 188 W Saint James St Unit 10311
- 188 W Saint James St Unit 11817
- 204 San Pedro Cir
- 536 Quailbrook Ct
- 548 Quailbrook Ct
- 532 Quailbrook Ct Unit 3
- 167 San Pedro Cir
- 193 San Pedro Cir
- 200 San Pedro Cir
- 208 San Pedro Cir Unit 23
- 161 San Pedro Cir Unit 38
- 202 San Pedro Cir
- 544 Quailbrook Ct
- 185 San Pedro Cir
- 527 Quailbrook Ct Unit 15
- 531 Quailbrook Ct Unit 14
- 537 Quailbrook Ct Unit 13
- 543 Quailbrook Ct
- 547 Quailbrook Ct
- 533 Quailbrook Ct
- 191 San Pedro Cir
- 189 San Pedro Cir Unit 35
Your Personal Tour Guide
Ask me questions while you tour the home.