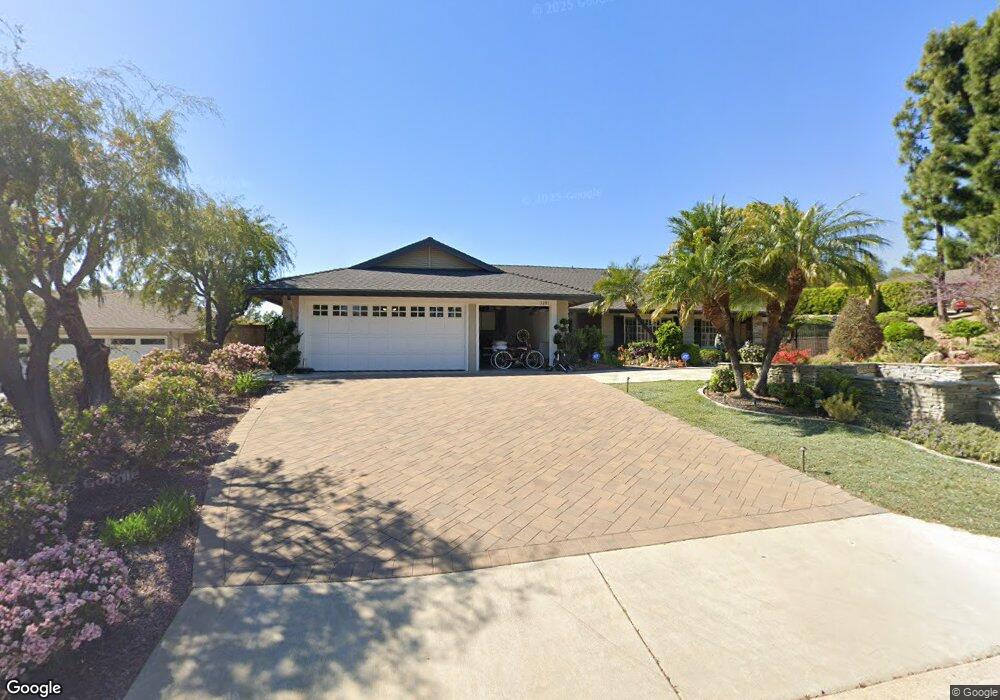
5281 Laurel View Cir Yorba Linda, CA 92886
Estimated Value: $1,439,956 - $1,657,000
4
Beds
3
Baths
2,350
Sq Ft
$669/Sq Ft
Est. Value
About This Home
This home is located at 5281 Laurel View Cir, Yorba Linda, CA 92886 and is currently estimated at $1,571,989, approximately $668 per square foot. 5281 Laurel View Cir is a home located in Orange County with nearby schools including Linda Vista Elementary School, Yorba Linda Middle School, and Friends Christian School.
Create a Home Valuation Report for This Property
The Home Valuation Report is an in-depth analysis detailing your home's value as well as a comparison with similar homes in the area
Home Values in the Area
Average Home Value in this Area
Tax History Compared to Growth
Tax History
| Year | Tax Paid | Tax Assessment Tax Assessment Total Assessment is a certain percentage of the fair market value that is determined by local assessors to be the total taxable value of land and additions on the property. | Land | Improvement |
|---|---|---|---|---|
| 2025 | $3,915 | $322,617 | $148,595 | $174,022 |
| 2024 | $3,915 | $316,292 | $145,682 | $170,610 |
| 2023 | $3,835 | $310,091 | $142,826 | $167,265 |
| 2022 | $3,782 | $304,011 | $140,025 | $163,986 |
| 2021 | $3,710 | $298,050 | $137,279 | $160,771 |
| 2020 | $3,597 | $294,994 | $135,871 | $159,123 |
| 2019 | $3,481 | $289,210 | $133,207 | $156,003 |
| 2018 | $3,435 | $283,540 | $130,595 | $152,945 |
| 2017 | $3,379 | $277,981 | $128,034 | $149,947 |
| 2016 | $3,311 | $272,531 | $125,524 | $147,007 |
| 2015 | $3,270 | $268,438 | $123,639 | $144,799 |
| 2014 | $3,174 | $263,180 | $121,217 | $141,963 |
Source: Public Records
Map
Nearby Homes
- 5152 Lakeview Ave
- 18083 Burke Ln
- 5231 Highland Ave
- 18044 Burke Ln
- 18571 Buena Vista Ave
- 5141 Siesta Ln
- 17841 Buena Vista Ave
- 4891 Eureka Ave Unit 25
- 4845 Eisenhower Ct
- 17842 Caballo Dr
- 4951 Oak Tree Ct
- 4760 Lakeview Ave
- 5992 Organza Dr
- 4788 Lakeview Ave Unit 48
- 17781 Lerene Dr
- 5661 Casa Loma Ave
- 5335 Grandview Ave
- 18931 Gordon Ln
- 18302 Piper Place
- 5371 Grandview Ave
- 5291 Laurel View Cir
- 5297 Laurel View Cir
- 18259 Laurel View Dr
- 18249 Laurel View Dr
- 5286 Laurel View Cir
- 18279 Laurel View Dr
- 5296 Laurel View Cir
- 5266 Laurel View Cir
- 18208 Laurel View Dr
- 18239 Laurel View Dr
- 18229 Laurel View Dr
- 18289 Laurel View Dr
- 18297 Shook Ln
- 18291 Shook Ln
- 18219 Laurel View Dr
- 18301 Shook Ln
- 18271 Shook Ln
- 18299 Laurel View Dr
- 18207 Shook Ln
- 5212 Highland Ave