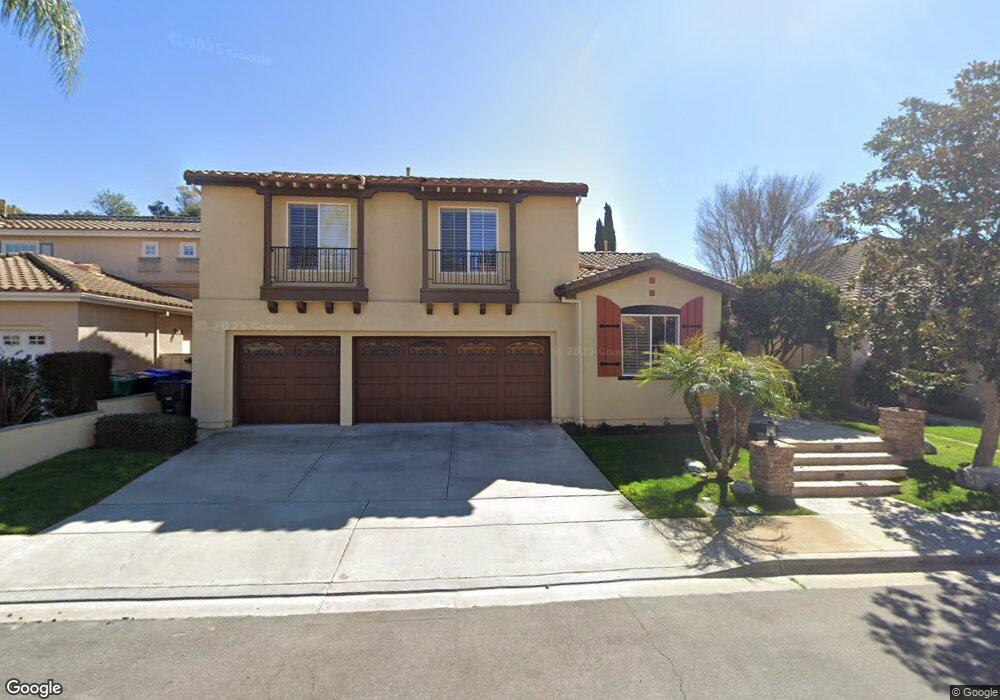
5283 Pearlman Way San Diego, CA 92130
Carmel Valley NeighborhoodEstimated Value: $2,384,125 - $2,666,000
4
Beds
3
Baths
3,197
Sq Ft
$809/Sq Ft
Est. Value
About This Home
This home is located at 5283 Pearlman Way, San Diego, CA 92130 and is currently estimated at $2,586,781, approximately $809 per square foot. 5283 Pearlman Way is a home located in San Diego County with nearby schools including Ashley Falls Elementary School, Pacific Trails Middle, and Torrey Pines High School.
Ownership History
Date
Name
Owned For
Owner Type
Purchase Details
Closed on
May 13, 2009
Sold by
Crecelius Allan M and Comrie Sandra M
Bought by
Comrie Sandra M and Crecelius Allan M
Current Estimated Value
Home Financials for this Owner
Home Financials are based on the most recent Mortgage that was taken out on this home.
Original Mortgage
$546,250
Outstanding Balance
$344,575
Interest Rate
4.82%
Mortgage Type
New Conventional
Estimated Equity
$2,242,206
Purchase Details
Closed on
Mar 26, 2004
Sold by
Comrie Sandra M and Crecelius Allan M
Bought by
Comrie Sandra M and Crecelius Allan M
Purchase Details
Closed on
May 8, 2001
Sold by
Chang Ta Peng and Chang Hsu Yi
Bought by
Crecelius Allan M and Comrie Sandra M
Home Financials for this Owner
Home Financials are based on the most recent Mortgage that was taken out on this home.
Original Mortgage
$584,000
Interest Rate
6.87%
Purchase Details
Closed on
Oct 16, 1997
Sold by
Pardee Construction Company
Bought by
Chang Ta Peng and Chang Hsu Yi
Create a Home Valuation Report for This Property
The Home Valuation Report is an in-depth analysis detailing your home's value as well as a comparison with similar homes in the area
Home Values in the Area
Average Home Value in this Area
Purchase History
| Date | Buyer | Sale Price | Title Company |
|---|---|---|---|
| Comrie Sandra M | -- | Accommodation | |
| Crecelius Allan M | -- | Chicago Title Company | |
| Comrie Sandra M | -- | -- | |
| Crecelius Allan M | $730,000 | First American Title Ins Co | |
| Chang Ta Peng | $427,000 | First American Title |
Source: Public Records
Mortgage History
| Date | Status | Borrower | Loan Amount |
|---|---|---|---|
| Open | Crecelius Allan M | $546,250 | |
| Closed | Crecelius Allan M | $584,000 |
Source: Public Records
Tax History Compared to Growth
Tax History
| Year | Tax Paid | Tax Assessment Tax Assessment Total Assessment is a certain percentage of the fair market value that is determined by local assessors to be the total taxable value of land and additions on the property. | Land | Improvement |
|---|---|---|---|---|
| 2025 | $12,779 | $1,099,977 | $723,276 | $376,701 |
| 2024 | $12,779 | $1,078,410 | $709,095 | $369,315 |
| 2023 | $12,688 | $1,057,266 | $695,192 | $362,074 |
| 2022 | $12,488 | $1,036,536 | $681,561 | $354,975 |
| 2021 | $12,080 | $1,016,213 | $668,198 | $348,015 |
| 2020 | $12,173 | $1,005,794 | $661,347 | $344,447 |
| 2019 | $11,960 | $986,074 | $648,380 | $337,694 |
| 2018 | $11,494 | $966,740 | $635,667 | $331,073 |
| 2017 | $11,303 | $947,785 | $623,203 | $324,582 |
| 2016 | $10,977 | $929,202 | $610,984 | $318,218 |
| 2015 | $10,833 | $915,246 | $601,807 | $313,439 |
| 2014 | $10,638 | $897,319 | $590,019 | $307,300 |
Source: Public Records
Map
Nearby Homes
- 4970 Beauchamp Ct
- 12722 Sandy Crest Ct
- 4919 Concannon Ct
- 13120 Chambord Way
- 5480 Valerio Trail
- 5582 Valerio Trail
- 5091 Ruette de Mer
- 5621 Shasta Daisy Trail
- 13625 Winstanley Way
- 4436 Heritage Glen Ln
- 5171 Del Mar Mesa Rd
- 12436 Cavallo St
- 4271 Corte Favor
- 5312 Sweetwater Trail
- 13016 Lumen Way
- 0 Grand Del Mar Place Unit VU 8-4-5 NDP2502279
- 5347 Morning Sage Way
- 12932 Peppergrass Creek Gate Unit 58
- 5146 Rancho Verde Trail
- 4945 Rancho Verde Trail
- 5269 Pearlman Way
- 5299 Pearlman Way
- 5267 Pearlman Way
- 5286 Pearlman Way
- 5268 Pearlman Way
- 5252 Pearlman Way
- 5296 Pearlman Way
- 5298 Pearlman Way
- 5247 Pearlman Way
- 5290 Beachcomber Ct
- 5243 Pearlman Way
- 5280 Beachcomber Ct
- 5357 Carmel Knolls Dr
- 5233 Pearlman Way
- 5260 Beachcomber Ct
- 5290 Vallery Ct
- 5365 Carmel Knolls Dr
- 5252 Beachcomber Ct
- 5207 Pearlman Way
- 5275 Vallery Ct