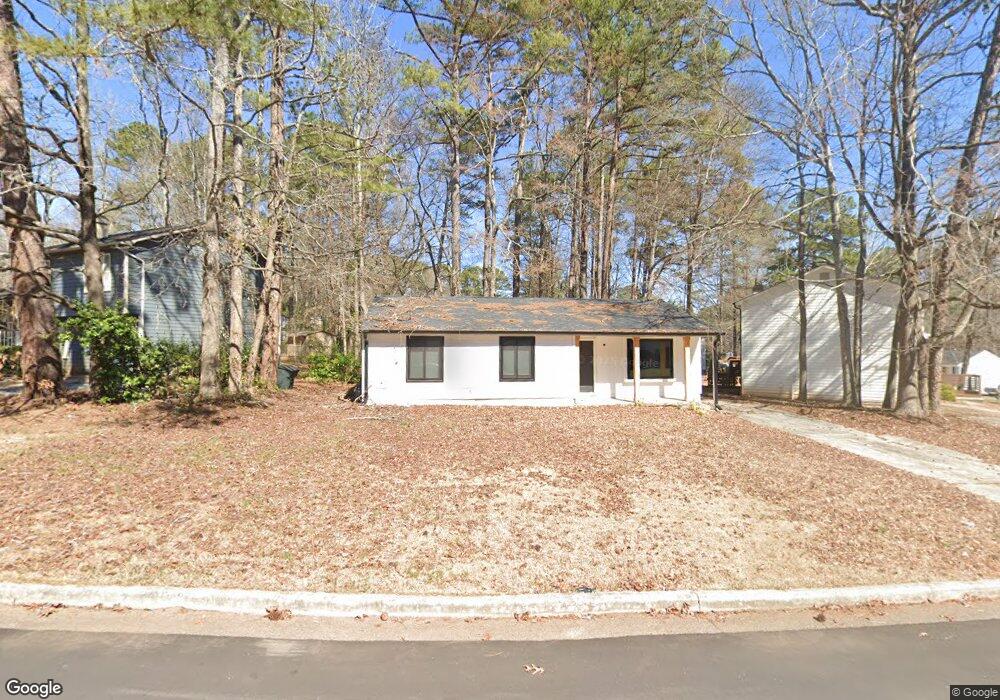
5284 Tasman Trail Unit 3 Lithonia, GA 30038
Estimated Value: $191,952 - $214,000
3
Beds
2
Baths
1,188
Sq Ft
$169/Sq Ft
Est. Value
About This Home
This home is located at 5284 Tasman Trail Unit 3, Lithonia, GA 30038 and is currently estimated at $200,738, approximately $168 per square foot. 5284 Tasman Trail Unit 3 is a home located in DeKalb County with nearby schools including Flat Rock Elementary School, Salem Middle School, and Martin Luther King- Jr. High School.
Ownership History
Date
Name
Owned For
Owner Type
Purchase Details
Closed on
Jun 17, 2015
Sold by
Gay Shekia
Bought by
Alemu Michael Moges
Current Estimated Value
Purchase Details
Closed on
Nov 19, 2004
Sold by
Hud
Bought by
Gay Shekia
Home Financials for this Owner
Home Financials are based on the most recent Mortgage that was taken out on this home.
Original Mortgage
$67,500
Interest Rate
5.6%
Mortgage Type
New Conventional
Purchase Details
Closed on
Feb 3, 2004
Sold by
Henley Lashonda
Bought by
Mortgage Electronic Registrati
Purchase Details
Closed on
Jul 30, 1999
Sold by
Andrews Trevor M and Andrews Saville
Bought by
Henley Lashonda
Home Financials for this Owner
Home Financials are based on the most recent Mortgage that was taken out on this home.
Original Mortgage
$78,859
Interest Rate
7.7%
Mortgage Type
FHA
Create a Home Valuation Report for This Property
The Home Valuation Report is an in-depth analysis detailing your home's value as well as a comparison with similar homes in the area
Home Values in the Area
Average Home Value in this Area
Purchase History
| Date | Buyer | Sale Price | Title Company |
|---|---|---|---|
| Alemu Michael Moges | -- | -- | |
| Gay Shekia | -- | -- | |
| Mortgage Electronic Registrati | $81,136 | -- | |
| Hud | -- | -- | |
| Henley Lashonda | $79,900 | -- |
Source: Public Records
Mortgage History
| Date | Status | Borrower | Loan Amount |
|---|---|---|---|
| Previous Owner | Gay Shekia | $67,500 | |
| Previous Owner | Henley Lashonda | $78,859 |
Source: Public Records
Tax History Compared to Growth
Tax History
| Year | Tax Paid | Tax Assessment Tax Assessment Total Assessment is a certain percentage of the fair market value that is determined by local assessors to be the total taxable value of land and additions on the property. | Land | Improvement |
|---|---|---|---|---|
| 2025 | $3,760 | $74,560 | $16,000 | $58,560 |
| 2024 | $3,641 | $72,480 | $16,000 | $56,480 |
| 2023 | $3,641 | $64,320 | $16,000 | $48,320 |
| 2022 | $2,713 | $54,600 | $4,800 | $49,800 |
| 2021 | $1,934 | $36,320 | $4,800 | $31,520 |
| 2020 | $1,775 | $33,080 | $4,800 | $28,280 |
| 2019 | $1,744 | $32,600 | $4,800 | $27,800 |
| 2018 | $1,389 | $25,560 | $4,800 | $20,760 |
| 2017 | $1,325 | $22,240 | $3,360 | $18,880 |
| 2016 | $1,140 | $18,720 | $3,360 | $15,360 |
| 2014 | $1,203 | $19,640 | $3,360 | $16,280 |
Source: Public Records
Map
Nearby Homes
- 5360 Tasman Trail
- 3274 Adelade Ct
- 5515 Rock Springs Rd
- 3340 Fannin Ct
- 3309 Panola Rd
- 5436 Brisbane Ct Unit 1
- 5364 Winslow Crossing
- 3248 Brisbane Way
- 5600 Rock Springs Rd
- 5415 Radford Ln
- 3515 Fannin Dr
- 5437 Winslow Crossing N
- 5536 La Fleur Trail
- 4923 Panola Mill Dr
- 5331 Salem Rd
- 5263 Salem Rd
- 5209 Salem Rd
- 5074 Great Meadows Rd
- 3512 Valley Chase Ct
- 3255 Hunters Crossing Point
- 5292 Tasman Trail
- 5276 Tasman Trail
- 5300 Tasman Trail
- 5268 Tasman Trail Unit 3
- 3289 Tasman Ct
- 5277 Tasman Trail
- 3301 Tasman Ct Unit 3
- 5260 Tasman Trail
- 5287 Tasman Trail
- 5291 Tasman Trail
- 5281 Tasman Trail
- 5271 Tasman Trail
- 5303 Tasman Trail
- 5297 Tasman Trail
- 5261 Tasman Trail
- 5250 Tasman Trail
- 5307 Tasman Trail
- 3280 Tasman Ct Unit 3280
- 3280 Tasman Ct
- 3280 Tasman Ct