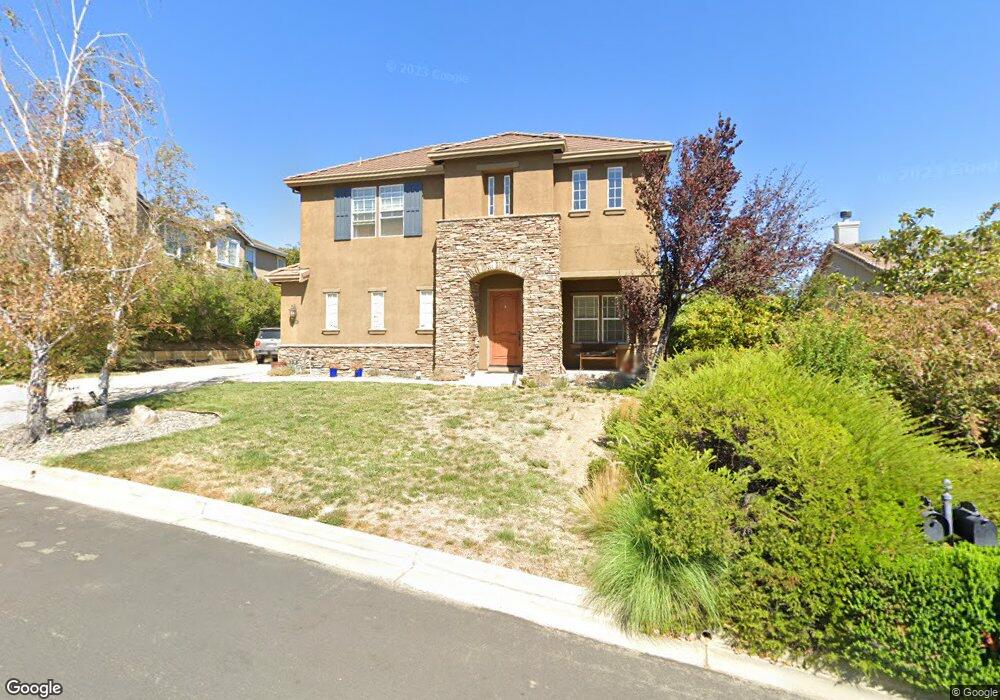
5285 Hiddencrest Ct Concord, CA 94521
The Highlands NeighborhoodEstimated Value: $1,684,000 - $1,906,257
4
Beds
5
Baths
4,287
Sq Ft
$422/Sq Ft
Est. Value
About This Home
This home is located at 5285 Hiddencrest Ct, Concord, CA 94521 and is currently estimated at $1,808,814, approximately $421 per square foot. 5285 Hiddencrest Ct is a home located in Contra Costa County with nearby schools including Highlands Elementary School, Mt. Diablo Elementary School, and Pine Hollow Middle School.
Ownership History
Date
Name
Owned For
Owner Type
Purchase Details
Closed on
Aug 26, 2023
Sold by
Savage Walter T and Savage Shelley J
Bought by
Savage Walter T
Current Estimated Value
Purchase Details
Closed on
May 11, 2016
Sold by
Savage Walter T
Bought by
Savage Walter T and Savage Shelley J
Home Financials for this Owner
Home Financials are based on the most recent Mortgage that was taken out on this home.
Original Mortgage
$705,000
Interest Rate
3.71%
Mortgage Type
New Conventional
Purchase Details
Closed on
May 21, 2002
Sold by
West Coast Home Builders Inc
Bought by
Savage Walter T
Home Financials for this Owner
Home Financials are based on the most recent Mortgage that was taken out on this home.
Original Mortgage
$683,275
Interest Rate
6.94%
Mortgage Type
Purchase Money Mortgage
Create a Home Valuation Report for This Property
The Home Valuation Report is an in-depth analysis detailing your home's value as well as a comparison with similar homes in the area
Home Values in the Area
Average Home Value in this Area
Purchase History
| Date | Buyer | Sale Price | Title Company |
|---|---|---|---|
| Savage Walter T | -- | None Listed On Document | |
| Savage Walter T | -- | Old Republic Title Company | |
| Savage Walter T | $1,051,500 | Old Republic Title Company |
Source: Public Records
Mortgage History
| Date | Status | Borrower | Loan Amount |
|---|---|---|---|
| Previous Owner | Savage Walter T | $705,000 | |
| Previous Owner | Savage Walter T | $683,275 | |
| Closed | Savage Walter T | $262,799 |
Source: Public Records
Tax History
| Year | Tax Paid | Tax Assessment Tax Assessment Total Assessment is a certain percentage of the fair market value that is determined by local assessors to be the total taxable value of land and additions on the property. | Land | Improvement |
|---|---|---|---|---|
| 2025 | $19,121 | $1,641,609 | $590,914 | $1,050,695 |
| 2024 | $18,363 | $1,609,422 | $579,328 | $1,030,094 |
| 2023 | $18,363 | $1,577,866 | $567,969 | $1,009,897 |
| 2022 | $18,169 | $1,546,929 | $556,833 | $990,096 |
| 2021 | $15,623 | $1,325,000 | $476,947 | $848,053 |
| 2019 | $14,268 | $1,190,000 | $428,354 | $761,646 |
| 2018 | $13,559 | $1,150,000 | $413,955 | $736,045 |
| 2017 | $13,127 | $1,127,000 | $405,676 | $721,324 |
| 2016 | $12,753 | $1,106,500 | $398,297 | $708,203 |
| 2015 | $12,239 | $1,052,000 | $378,679 | $673,321 |
| 2014 | $10,983 | $934,500 | $336,383 | $598,117 |
Source: Public Records
Map
Nearby Homes
- 995 Rosehedge Ct
- 1109 Discovery Way
- 5308 Vista Point Ct
- 5350 Fernbank Dr Unit 1
- 1109 Vista Point Ln
- 5391 Fernbank Dr
- 868 Deer Spring Cir
- 1271 Kentucky Dr
- 1120 Kenwal Rd Unit C
- 5434 Roundtree Ct Unit A
- 1160 Kenwal Rd Unit D
- 5500 Lewis Way
- 5451 Roundtree Place
- 5492 Roundtree Dr Unit A
- 5549 Alabama Dr
- 1395 Kenwal Rd Unit A
- 4497 Wildberry Ct
- 4501 Shellflower Ct
- 4495 Wildberry Ct
- 5510 Alaska Dr
- 5283 Hiddencrest Ct
- 5295 Hiddencrest Ct
- 5281 Hiddencrest Ct
- 5286 Hiddencrest Ct
- 5288 Hiddencrest Ct
- 5290 Hiddencrest Ct
- 5279 Hiddencrest Ct
- 5294 Hiddencrest Ct
- 5284 Hiddencrest Ct
- 5298 Hiddencrest Ct
- 5280 Hiddencrest Ct
- 5273 Hiddencrest Ct
- 5282 Hiddencrest Ct
- 1050 Laurel Tree Dr
- 955 Autumn Oak Cir
- 951 Autumn Oak Cir
- 959 Autumn Oak Cir
- 961 Autumn Oak Cir
- 5269 Hiddencrest Ct
- 1046 Laurel Tree Dr
Your Personal Tour Guide
Ask me questions while you tour the home.