Estimated Value: $224,000 - $297,000
4
Beds
3
Baths
1,700
Sq Ft
$150/Sq Ft
Est. Value
About This Home
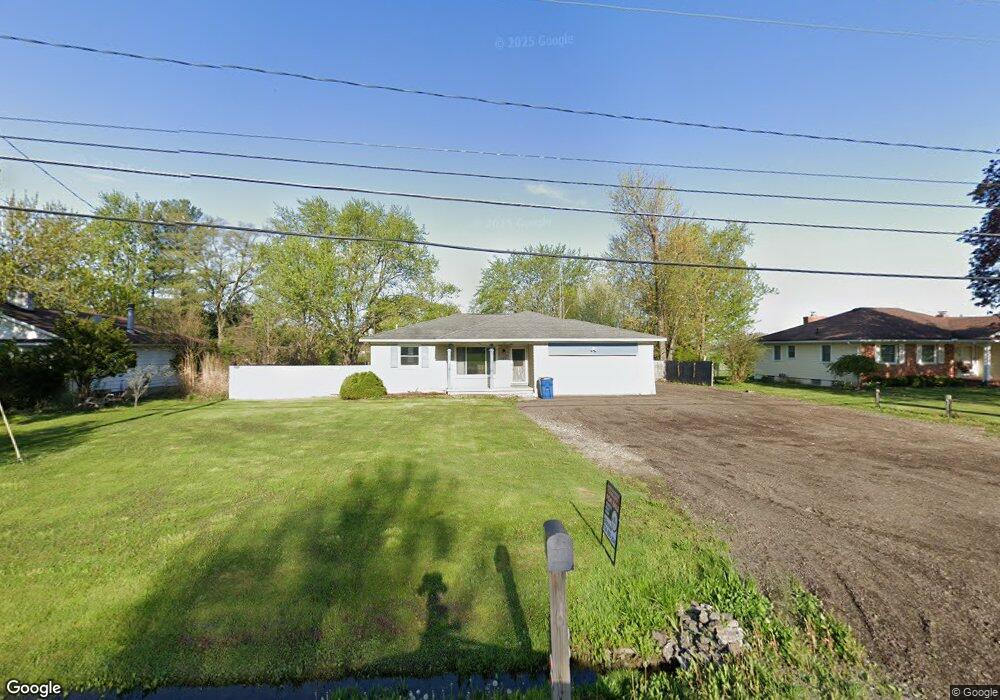
This home is located at 5288 Torrey Rd, Flint, MI 48507 and is currently estimated at $255,070, approximately $150 per square foot. 5288 Torrey Rd is a home located in Genesee County with nearby schools including Carman-Ainsworth High School, Madison Academy - Elementary School, and Discovery Montessori.
Ownership History
Date
Name
Owned For
Owner Type
Purchase Details
Closed on
Jun 15, 2018
Sold by
Hale Charles Edward
Bought by
Hale Charles Ray
Current Estimated Value
Purchase Details
Closed on
Sep 23, 2014
Sold by
Smith Pamela
Bought by
Hale Charles and Hale Charles Edward
Purchase Details
Closed on
Aug 25, 2008
Sold by
Homesales Inc
Bought by
Smith Pamela A
Purchase Details
Closed on
May 25, 2007
Sold by
Jp Morgan Chase Bank Na
Bought by
Homesales Inc
Purchase Details
Closed on
May 4, 2007
Sold by
Leddick Daniel W and Leddick Lori L
Bought by
Jp Morgan Chase Bank Na
Purchase Details
Closed on
Mar 28, 2007
Sold by
Leddick Daniel W and Leddick Lori L
Bought by
Deutsche Bank National Trust Co
Purchase Details
Closed on
Feb 4, 2003
Sold by
Leddick Daniel W
Bought by
Leddick Daniel W and Leddick Lori L
Purchase Details
Closed on
Nov 18, 1999
Sold by
Barron Yvonne S
Bought by
Leddick Daniel W
Create a Home Valuation Report for This Property
The Home Valuation Report is an in-depth analysis detailing your home's value as well as a comparison with similar homes in the area
Home Values in the Area
Average Home Value in this Area
Purchase History
| Date | Buyer | Sale Price | Title Company |
|---|---|---|---|
| Hale Charles Ray | -- | None Available | |
| Hale Charles | -- | None Available | |
| Smith Pamela A | $55,000 | Heritagage Title Svcs Llc | |
| Homesales Inc | -- | None Available | |
| Jp Morgan Chase Bank Na | $143,218 | None Available | |
| Deutsche Bank National Trust Co | $124,283 | None Available | |
| Leddick Daniel W | -- | -- | |
| Leddick Daniel W | $116,100 | Greco Title |
Source: Public Records
Tax History
| Year | Tax Paid | Tax Assessment Tax Assessment Total Assessment is a certain percentage of the fair market value that is determined by local assessors to be the total taxable value of land and additions on the property. | Land | Improvement |
|---|---|---|---|---|
| 2025 | $2,749 | $104,100 | $0 | $0 |
| 2024 | $1,646 | $97,700 | $0 | $0 |
| 2023 | $1,570 | $88,100 | $0 | $0 |
| 2022 | $2,463 | $80,600 | $0 | $0 |
| 2021 | $2,394 | $76,500 | $0 | $0 |
| 2020 | $1,449 | $72,200 | $0 | $0 |
| 2019 | $1,427 | $68,600 | $0 | $0 |
| 2018 | $3,024 | $63,700 | $0 | $0 |
| 2017 | $2,905 | $63,000 | $0 | $0 |
| 2016 | $2,878 | $59,400 | $0 | $0 |
| 2015 | $2,713 | $56,200 | $0 | $0 |
| 2014 | $937 | $51,000 | $0 | $0 |
| 2012 | -- | $46,100 | $46,100 | $0 |
Source: Public Records
Map
Nearby Homes
- 2051 W Maple Ave
- 5131 Gateway Centre Blvd
- 2502 Hutchinson Ln
- 5366 van Slyke Rd
- 6042 Birch Dr
- 4462 Westmont Dr
- 2029 Gerard St
- 0 Taylor Dr Unit 50159493
- 2077 Kingswood Dr
- 6095 Weyerbacher Dr
- 1408 Williamsburg Rd
- G4203 van Slyke Rd
- 1489 Maria St
- 6123 King Arthur Dr
- 1380 Sunset Blvd
- 4444 Carmanwood Dr
- 5141 W Bristol Rd
- 4460 Bristolwood Dr
- 1151 Bristol Rd
- 1195 Alton Ave
- 5280 Torrey Rd
- 5280 Torrey Rd
- 5300 Torrey Rd
- 5290 Torrey Rd
- 5290 Torrey Rd
- 5316 Torrey Rd
- 5334 Torrey Rd
- 5297 Torrey Rd
- 330 King George III Dr
- 329 King George III Dr
- 5283 Torrey Rd
- 5313 Torrey Rd
- 293 King George III Dr
- 292 King George III Dr
- 291 King George III Dr
- 290 King George III Dr
- 289 King George III Dr
- 288 King George III Dr
- 287 King George III Dr
- 286 King George III Dr
Your Personal Tour Guide
Ask me questions while you tour the home.