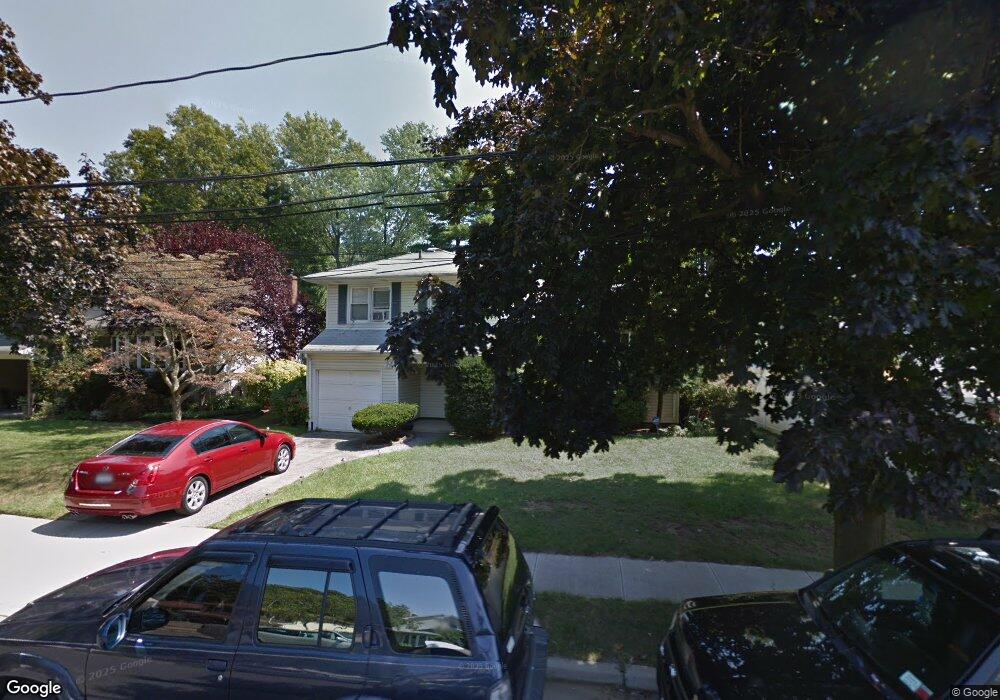
529 Kent Place West Hempstead, NY 11552
Estimated Value: $756,000 - $825,459
3
Beds
2
Baths
1,207
Sq Ft
$655/Sq Ft
Est. Value
About This Home
This home is located at 529 Kent Place, West Hempstead, NY 11552 and is currently estimated at $790,730, approximately $655 per square foot. 529 Kent Place is a home located in Nassau County with nearby schools including Chestnut Street School, West Hempstead Secondary School, and Roosevelt Children's Academy.
Ownership History
Date
Name
Owned For
Owner Type
Purchase Details
Closed on
Apr 16, 2021
Sold by
Brown Annmarie D and Orriola Victor M
Bought by
Brown Harriott Annmaried D and Harriott Paul A
Current Estimated Value
Purchase Details
Closed on
Feb 24, 2009
Sold by
Babar Angelina
Bought by
Brown Annmarie
Create a Home Valuation Report for This Property
The Home Valuation Report is an in-depth analysis detailing your home's value as well as a comparison with similar homes in the area
Home Values in the Area
Average Home Value in this Area
Purchase History
| Date | Buyer | Sale Price | Title Company |
|---|---|---|---|
| Brown Harriott Annmaried D | -- | None Available | |
| Brown Annmarie | $418,000 | -- |
Source: Public Records
Tax History Compared to Growth
Tax History
| Year | Tax Paid | Tax Assessment Tax Assessment Total Assessment is a certain percentage of the fair market value that is determined by local assessors to be the total taxable value of land and additions on the property. | Land | Improvement |
|---|---|---|---|---|
| 2025 | $13,237 | $513 | $290 | $223 |
| 2024 | $4,039 | $513 | $290 | $223 |
| 2023 | $11,867 | $543 | $309 | $234 |
| 2022 | $11,867 | $513 | $290 | $223 |
| 2021 | $13,675 | $506 | $263 | $243 |
| 2020 | $9,657 | $685 | $372 | $313 |
| 2019 | $3,644 | $689 | $374 | $315 |
| 2018 | $3,458 | $689 | $0 | $0 |
| 2017 | $5,986 | $689 | $374 | $315 |
| 2016 | $9,305 | $689 | $374 | $315 |
| 2015 | $3,557 | $689 | $374 | $315 |
| 2014 | $3,557 | $689 | $374 | $315 |
| 2013 | $3,339 | $689 | $374 | $315 |
Source: Public Records
Map
Nearby Homes
- 596 Lincoln Ave
- 513 Washington Ave
- 629 Park Ave
- 647 Jennings Ave
- 639 Robin Ct
- 321 Oakford St
- 467 Susan Ct
- 815 Sunshine Ave
- 757 Harrison St
- 686 Tanwood Dr
- 55 Melvin Ave
- 853 Arthur St
- 635 Hempstead Ave
- 841 Woodfield Rd
- 590 Langley Ave
- 185 Maxine Ct
- 613 Adams Ave
- 218 Colony St
- 352 Hempstead Ave
- 301 Coventry Rd N