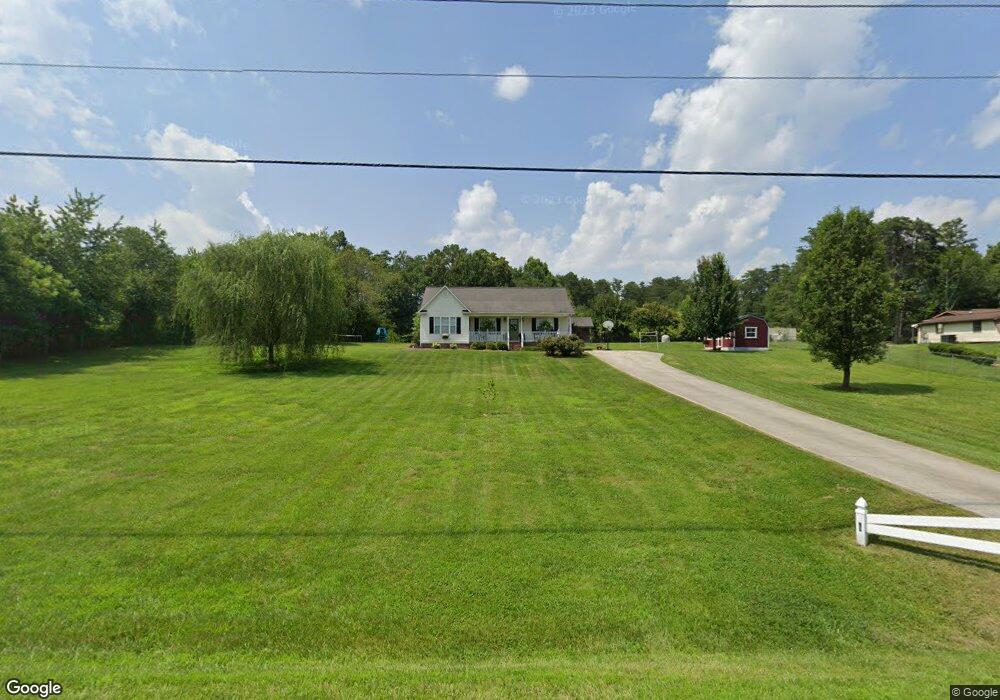
529 Kiser Rd Bessemer City, NC 28016
Estimated Value: $284,000 - $414,000
3
Beds
2
Baths
1,267
Sq Ft
$254/Sq Ft
Est. Value
About This Home
This home is located at 529 Kiser Rd, Bessemer City, NC 28016 and is currently estimated at $322,112, approximately $254 per square foot. 529 Kiser Rd is a home located in Gaston County with nearby schools including Tryon Elementary School, Bessemer City Middle School, and Bessemer City High School.
Ownership History
Date
Name
Owned For
Owner Type
Purchase Details
Closed on
Jul 15, 2011
Sold by
Federal Home Loan Mortgage Corporation
Bought by
Lanford Justin R and Eaves Miranda B
Current Estimated Value
Home Financials for this Owner
Home Financials are based on the most recent Mortgage that was taken out on this home.
Original Mortgage
$77,720
Outstanding Balance
$53,570
Interest Rate
4.55%
Mortgage Type
New Conventional
Estimated Equity
$268,542
Purchase Details
Closed on
Apr 13, 2011
Sold by
Long Frank R and Long Rebecca J
Bought by
Federal Home Loan Mortgage Corp
Purchase Details
Closed on
Dec 7, 2000
Sold by
Johnson & Associates Real Estate Inc
Bought by
Long Frank R and Long Rebecca J
Home Financials for this Owner
Home Financials are based on the most recent Mortgage that was taken out on this home.
Original Mortgage
$89,900
Interest Rate
7.71%
Create a Home Valuation Report for This Property
The Home Valuation Report is an in-depth analysis detailing your home's value as well as a comparison with similar homes in the area
Home Values in the Area
Average Home Value in this Area
Purchase History
| Date | Buyer | Sale Price | Title Company |
|---|---|---|---|
| Lanford Justin R | -- | None Available | |
| Federal Home Loan Mortgage Corp | $89,830 | None Available | |
| Long Frank R | $90,000 | -- |
Source: Public Records
Mortgage History
| Date | Status | Borrower | Loan Amount |
|---|---|---|---|
| Open | Lanford Justin R | $77,720 | |
| Previous Owner | Long Frank R | $89,900 |
Source: Public Records
Tax History Compared to Growth
Tax History
| Year | Tax Paid | Tax Assessment Tax Assessment Total Assessment is a certain percentage of the fair market value that is determined by local assessors to be the total taxable value of land and additions on the property. | Land | Improvement |
|---|---|---|---|---|
| 2025 | $1,418 | $217,320 | $17,150 | $200,170 |
| 2024 | $1,418 | $198,650 | $17,150 | $181,500 |
| 2023 | $1,381 | $198,650 | $17,150 | $181,500 |
| 2022 | $1,170 | $127,150 | $14,700 | $112,450 |
| 2021 | $1,184 | $127,150 | $14,700 | $112,450 |
| 2020 | $1,158 | $127,150 | $14,700 | $112,450 |
| 2019 | $1,171 | $127,150 | $14,700 | $112,450 |
| 2018 | $1,137 | $117,797 | $16,000 | $101,797 |
| 2017 | $1,056 | $114,277 | $16,000 | $98,277 |
| 2016 | $1,056 | $110,719 | $0 | $0 |
| 2014 | $1,092 | $114,980 | $19,600 | $95,380 |
Source: Public Records
Map
Nearby Homes
- 1037 Dameron Rd
- 648 Kiser Rd
- 731 Kiser Rd
- 222 Kiser Rd
- 2002 Plain Field Dr
- 1021 Harrogate Dr
- 1041 Harrogate Dr
- 1502 Iron Forge Ct
- 1505 Iron Forge Ct
- 1512 Iron Forge Ct
- 1511 Iron Forge Ct
- 5533 Harvest Hills Rd
- 130 Inglebrook Ln
- 210 Linville Ct
- 129 Williams Rd
- 200 Thorne Rd
- 0000B Dallas Cherryville Hwy
- 0000 Dallas Cherryville Hwy
- 2047 Puetts Chapel Rd
- 000 Dameron Rd