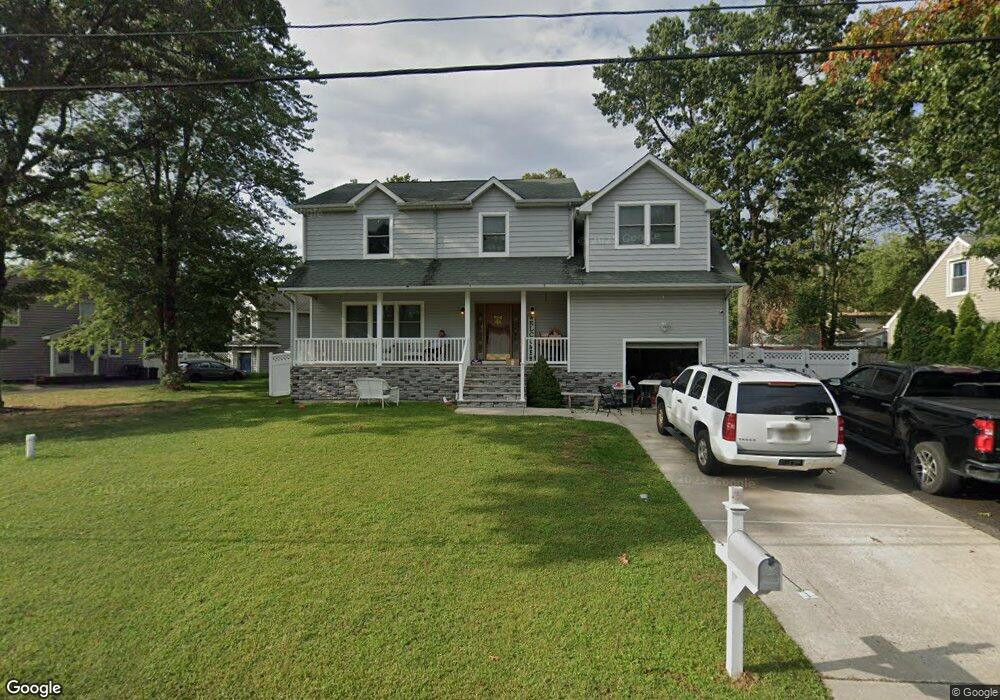
529 Middle Ln Howell, NJ 07731
Southard NeighborhoodEstimated Value: $694,733 - $732,000
--
Bed
--
Bath
2,068
Sq Ft
$342/Sq Ft
Est. Value
About This Home
This home is located at 529 Middle Ln, Howell, NJ 07731 and is currently estimated at $707,933, approximately $342 per square foot. 529 Middle Ln is a home with nearby schools including Taunton School, Aldrich School, and Howell Township Middle School South.
Ownership History
Date
Name
Owned For
Owner Type
Purchase Details
Closed on
Oct 1, 2014
Sold by
Zukas Mindaugas
Bought by
Rueck Robert C and Rueck Philip
Current Estimated Value
Home Financials for this Owner
Home Financials are based on the most recent Mortgage that was taken out on this home.
Original Mortgage
$324,022
Outstanding Balance
$249,774
Interest Rate
4.25%
Mortgage Type
FHA
Estimated Equity
$458,159
Purchase Details
Closed on
Oct 1, 2009
Sold by
Jay & Kay Development Llc
Bought by
Plumbing Zuk
Purchase Details
Closed on
Jun 22, 2004
Sold by
Va
Bought by
Jay And Key Developing Llc
Create a Home Valuation Report for This Property
The Home Valuation Report is an in-depth analysis detailing your home's value as well as a comparison with similar homes in the area
Home Values in the Area
Average Home Value in this Area
Purchase History
| Date | Buyer | Sale Price | Title Company |
|---|---|---|---|
| Rueck Robert C | $330,000 | Multiple | |
| Plumbing Zuk | $68,000 | Counsellors Title Agency Inc | |
| Jay And Key Developing Llc | $54,100 | -- |
Source: Public Records
Mortgage History
| Date | Status | Borrower | Loan Amount |
|---|---|---|---|
| Open | Rueck Robert C | $324,022 |
Source: Public Records
Tax History Compared to Growth
Tax History
| Year | Tax Paid | Tax Assessment Tax Assessment Total Assessment is a certain percentage of the fair market value that is determined by local assessors to be the total taxable value of land and additions on the property. | Land | Improvement |
|---|---|---|---|---|
| 2025 | $9,199 | $546,000 | $175,200 | $370,800 |
| 2024 | $9,299 | $517,400 | $161,500 | $355,900 |
| 2023 | $9,299 | $499,700 | $148,200 | $351,500 |
| 2022 | $9,007 | $465,400 | $127,200 | $338,200 |
| 2021 | $9,007 | $392,300 | $91,500 | $300,800 |
| 2020 | $9,107 | $392,200 | $91,500 | $300,700 |
| 2019 | $9,235 | $390,300 | $91,500 | $298,800 |
| 2018 | $8,717 | $366,100 | $78,200 | $287,900 |
| 2017 | $8,748 | $363,300 | $78,200 | $285,100 |
| 2016 | $8,687 | $357,200 | $67,700 | $289,500 |
| 2015 | $8,661 | $352,500 | $70,500 | $282,000 |
| 2014 | $8,002 | $302,200 | $78,100 | $224,100 |
Source: Public Records
Map
Nearby Homes