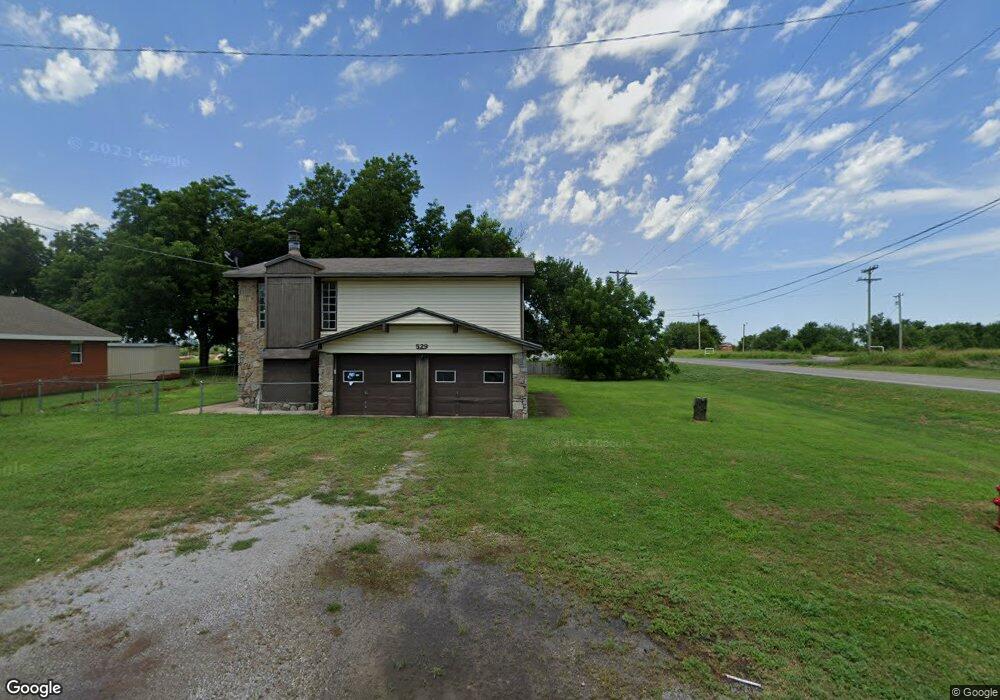
529 Mount Scott St Apache, OK 73006
Estimated Value: $93,000 - $135,053
3
Beds
2
Baths
2,000
Sq Ft
$55/Sq Ft
Est. Value
About This Home
This home is located at 529 Mount Scott St, Apache, OK 73006 and is currently estimated at $110,513, approximately $55 per square foot. 529 Mount Scott St is a home located in Caddo County with nearby schools including Apache Elementary School, Apache Middle School, and Apache High School.
Ownership History
Date
Name
Owned For
Owner Type
Purchase Details
Closed on
Oct 25, 2024
Sold by
Hicks Mathew L
Bought by
Hicks Mathew L and Kloer-Williams Bonnie
Current Estimated Value
Home Financials for this Owner
Home Financials are based on the most recent Mortgage that was taken out on this home.
Original Mortgage
$96,404
Outstanding Balance
$95,165
Interest Rate
6.2%
Mortgage Type
FHA
Estimated Equity
$15,348
Purchase Details
Closed on
Nov 21, 2018
Sold by
Josey Tanner E and Josey Nicole
Bought by
Finchum Aaron and Finchum Jody
Home Financials for this Owner
Home Financials are based on the most recent Mortgage that was taken out on this home.
Original Mortgage
$87,340
Interest Rate
4.8%
Mortgage Type
FHA
Purchase Details
Closed on
Nov 16, 2011
Sold by
Cain Gene
Bought by
Veterns Affairs An Officer Of The Unite
Purchase Details
Closed on
May 1, 1992
Create a Home Valuation Report for This Property
The Home Valuation Report is an in-depth analysis detailing your home's value as well as a comparison with similar homes in the area
Purchase History
| Date | Buyer | Sale Price | Title Company |
|---|---|---|---|
| Hicks Mathew L | $14,666 | Titan & Closing Llc | |
| Hicks Mathew L | $14,666 | Titan & Closing Llc | |
| Hicks Matthew L | $16,000 | None Listed On Document | |
| Hicks Matthew L | $16,000 | None Listed On Document | |
| Finchum Aaron | $90,000 | None Available | |
| Veterns Affairs An Officer Of The Unite | -- | -- | |
| -- | $61,000 | -- |
Source: Public Records
Mortgage History
| Date | Status | Borrower | Loan Amount |
|---|---|---|---|
| Open | Hicks Matthew L | $96,404 | |
| Closed | Hicks Matthew L | $96,404 | |
| Previous Owner | Finchum Aaron | $87,340 |
Source: Public Records
Tax History
| Year | Tax Paid | Tax Assessment Tax Assessment Total Assessment is a certain percentage of the fair market value that is determined by local assessors to be the total taxable value of land and additions on the property. | Land | Improvement |
|---|---|---|---|---|
| 2025 | $1,219 | $12,843 | $556 | $12,287 |
| 2024 | $1,220 | $12,231 | $556 | $11,675 |
| 2023 | $1,193 | $10,930 | $476 | $10,454 |
| 2022 | $956 | $10,443 | $476 | $9,967 |
| 2021 | $1,228 | $10,609 | $476 | $10,133 |
| 2020 | $1,015 | $10,104 | $476 | $9,628 |
| 2019 | $1,032 | $10,104 | $476 | $9,628 |
| 2018 | $1,079 | $10,780 | $477 | $10,303 |
| 2017 | $1,023 | $10,780 | $477 | $10,303 |
| 2016 | $109 | $1,022 | $477 | $545 |
| 2015 | $77 | $974 | $477 | $497 |
| 2014 | $598 | $7,244 | $477 | $6,767 |
Source: Public Records
Map
Nearby Homes
- TBD 2580
- TBD NE King Rd
- TBD Highway 281
- TBD U S Highway 62
- 301 E Mckinley Ave
- 223 Oak St
- 105 London Dr
- 1100 NE King Rd
- 207 N Hillside Rd
- 116 N Lakeside Dr
- 115 N Brookdale
- TBD Hilltop Rd
- 120 NE Kiowa Rd
- 124 Ellsworth Dr
- 13145 NE Clearwater Cir
- 40001 U S 281
- 13872 NW Stoney Point Rd
- 1430
- 67 Ash Ave
- 21168 County Road 1480
- 525 N Mt Scott St
- 616 W Apache Trail Rd
- 526 W Apache Trail Rd
- 518 W Apache Trail Rd
- 503 N Mt Scott St
- 504 W Apache Trail Rd
- 413 N Mt Scott St
- 420 N Mt Scott St
- 202 N Mt Scott St
- 414 N Mt Scott St
- 45184 County Street 2590
- 802 E Apache Trail Rd
- 504 Mount Scott St
- 405 N Mt Scott St
- 317 N Mt Scott St
- 310 N Mt Scott St
- 817 W Apache Trail Rd
- 122 W Mckinley Ave
- 302 N Mt Scott St
- 308 W Apache Trail Rd
Your Personal Tour Guide
Ask me questions while you tour the home.