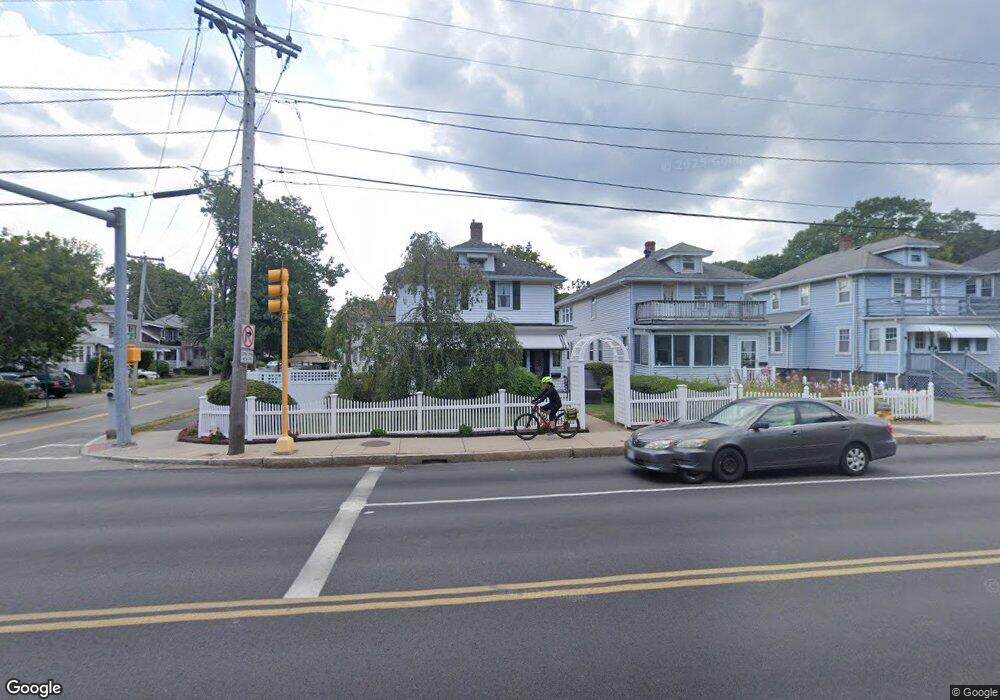
529 Newport Ave Quincy, MA 02170
Quincy Center NeighborhoodEstimated Value: $661,000 - $738,237
3
Beds
1
Bath
1,500
Sq Ft
$469/Sq Ft
Est. Value
About This Home
This home is located at 529 Newport Ave, Quincy, MA 02170 and is currently estimated at $704,059, approximately $469 per square foot. 529 Newport Ave is a home located in Norfolk County with nearby schools including Charles A. Bernazzani Elementary School, Central Middle School, and North Quincy High School.
Ownership History
Date
Name
Owned For
Owner Type
Purchase Details
Closed on
Mar 3, 2020
Sold by
Morrissey Kevin D and Morrissey Susan M
Bought by
Morrissey Ft
Current Estimated Value
Purchase Details
Closed on
Nov 20, 1992
Sold by
Trubiano Susan M
Bought by
Morrissey Kevin D and Morrissey Susan M
Create a Home Valuation Report for This Property
The Home Valuation Report is an in-depth analysis detailing your home's value as well as a comparison with similar homes in the area
Home Values in the Area
Average Home Value in this Area
Purchase History
| Date | Buyer | Sale Price | Title Company |
|---|---|---|---|
| Morrissey Ft | -- | None Available | |
| Morrissey Kevin D | $129,000 | -- |
Source: Public Records
Mortgage History
| Date | Status | Borrower | Loan Amount |
|---|---|---|---|
| Previous Owner | Morrissey Kevin D | $165,000 | |
| Previous Owner | Morrissey Kevin D | $35,000 | |
| Previous Owner | Morrissey Kevin D | $25,000 | |
| Previous Owner | Morrissey Kevin D | $107,000 |
Source: Public Records
Tax History Compared to Growth
Tax History
| Year | Tax Paid | Tax Assessment Tax Assessment Total Assessment is a certain percentage of the fair market value that is determined by local assessors to be the total taxable value of land and additions on the property. | Land | Improvement |
|---|---|---|---|---|
| 2025 | $7,558 | $655,500 | $313,700 | $341,800 |
| 2024 | $7,117 | $631,500 | $296,300 | $335,200 |
| 2023 | $6,621 | $594,900 | $282,200 | $312,700 |
| 2022 | $6,129 | $511,600 | $225,700 | $285,900 |
| 2021 | $6,089 | $501,600 | $225,700 | $275,900 |
| 2020 | $5,581 | $449,000 | $212,500 | $236,500 |
| 2019 | $5,329 | $424,600 | $198,600 | $226,000 |
| 2018 | $5,360 | $401,800 | $191,700 | $210,100 |
| 2017 | $5,430 | $383,200 | $191,700 | $191,500 |
| 2016 | $5,208 | $362,700 | $182,500 | $180,200 |
| 2015 | $4,933 | $337,900 | $171,500 | $166,400 |
| 2014 | $4,581 | $308,300 | $159,800 | $148,500 |
Source: Public Records
Map
Nearby Homes
- 45 Oval Rd Unit 6
- 72 Oakland Ave
- 165 Old Colony Ave Unit A
- 57 Willow Ave
- 22 Newton Ave
- 129 Grand View Ave
- 111 Warren Ave Unit 1F
- 163 Clay St Unit C
- 1025 Hancock St Unit 12K
- 1025 Hancock St Unit 1K
- 89 Puritan Dr
- 35 Estabrook Rd
- 365 Newport Ave Unit 301
- 14 Priscilla Ln
- 45 Marion St
- 1 Adams St Unit 707
- 1 Adams St Unit 502
- 312 Adams St
- 129 Beale St
- 95 Monroe Rd Unit 2L
- 527 Newport Ave
- 11 Willow Ave
- 525 Newport Ave
- 541 Newport Ave
- 10 Oakland Ave
- 13 Willow Ave
- 8 Oakland Ave
- 2 Oakland Ave
- 2 Oakland Ave
- 2 Oakland Ave
- 2 Oakland Ave Unit 2
- 10 Willow Ave
- 10 Willow Ave Unit 229
- 545 Newport Ave
- 17 Willow Ave
- 12 Willow Ave
- 16 Oakland Ave
- 23 Willow Ave
- 16 Willow Ave
- 18 Oakland Ave