Estimated Value: $377,619 - $386,000
4
Beds
2
Baths
1,895
Sq Ft
$202/Sq Ft
Est. Value
About This Home
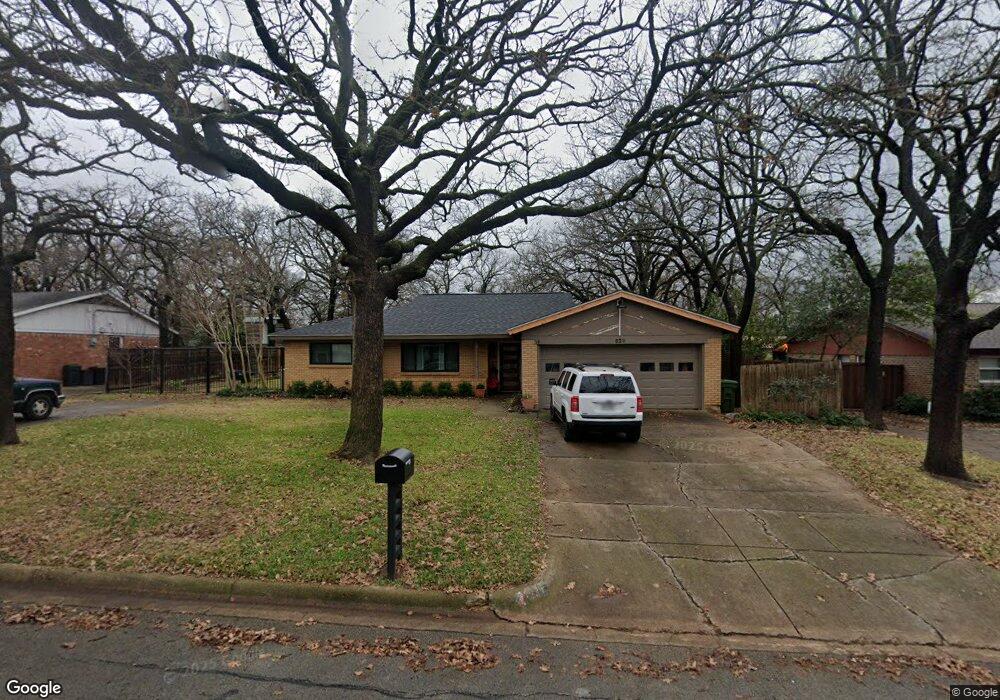
This home is located at 529 W Pleasantview Dr, Hurst, TX 76054 and is currently estimated at $382,655, approximately $201 per square foot. 529 W Pleasantview Dr is a home located in Tarrant County with nearby schools including Shady Oaks Elementary School, Bedford Junior High School, and L.D. Bell High School.
Ownership History
Date
Name
Owned For
Owner Type
Purchase Details
Closed on
Jul 17, 2015
Sold by
Kenney Kristi and Goddard Nancy
Bought by
Ryon David R and Ryon Anne A
Current Estimated Value
Home Financials for this Owner
Home Financials are based on the most recent Mortgage that was taken out on this home.
Original Mortgage
$116,000
Interest Rate
3.9%
Mortgage Type
New Conventional
Purchase Details
Closed on
Sep 30, 2013
Sold by
Estill Emily R
Bought by
Dibble Richard S and Dibble Patricia A
Purchase Details
Closed on
Jul 12, 2006
Sold by
Bell James and Bell Michele
Bought by
Kenney Kristi and Butler Tammy
Home Financials for this Owner
Home Financials are based on the most recent Mortgage that was taken out on this home.
Original Mortgage
$115,200
Interest Rate
6.67%
Mortgage Type
Purchase Money Mortgage
Purchase Details
Closed on
Jul 29, 2002
Sold by
Myers John P and Myers Patricia Myers
Bought by
Bell James and Bell Michele
Home Financials for this Owner
Home Financials are based on the most recent Mortgage that was taken out on this home.
Original Mortgage
$111,650
Interest Rate
6.62%
Mortgage Type
FHA
Create a Home Valuation Report for This Property
The Home Valuation Report is an in-depth analysis detailing your home's value as well as a comparison with similar homes in the area
Home Values in the Area
Average Home Value in this Area
Purchase History
| Date | Buyer | Sale Price | Title Company |
|---|---|---|---|
| Ryon David R | -- | Rtc | |
| Dibble Richard S | -- | None Available | |
| Kenney Kristi | -- | None Available | |
| Bell James | -- | Safeco Land Title |
Source: Public Records
Mortgage History
| Date | Status | Borrower | Loan Amount |
|---|---|---|---|
| Previous Owner | Ryon David R | $116,000 | |
| Previous Owner | Kenney Kristi | $115,200 | |
| Previous Owner | Bell James | $111,650 |
Source: Public Records
Tax History Compared to Growth
Tax History
| Year | Tax Paid | Tax Assessment Tax Assessment Total Assessment is a certain percentage of the fair market value that is determined by local assessors to be the total taxable value of land and additions on the property. | Land | Improvement |
|---|---|---|---|---|
| 2025 | $2,723 | $391,588 | $75,000 | $316,588 |
| 2024 | $2,723 | $391,588 | $75,000 | $316,588 |
| 2023 | $2,791 | $328,361 | $45,000 | $283,361 |
| 2022 | $6,835 | $298,723 | $45,000 | $253,723 |
| 2021 | $6,509 | $269,872 | $45,000 | $224,872 |
| 2020 | $6,107 | $253,839 | $45,000 | $208,839 |
| 2019 | $5,969 | $246,713 | $45,000 | $201,713 |
Source: Public Records
Map
Nearby Homes
- 521 Brookview Dr
- 532 Plainview Dr
- 612 Circleview Dr S
- 425 W Pleasantview Dr
- 432 Hillview Dr
- 1428 Pamela St
- 1417 Karla Dr
- 1625 Oak Creek Dr
- 709 W Pleasantview Dr
- 405 W Louella Dr
- 440 W Louella Dr
- 827 W Harwood Rd Unit D
- 823 W Harwood Rd
- 201 Hillview Dr
- 833 W Harwood Rd Unit F
- 421 Cavender Ct
- 1208 Birch St
- 1208 Karla Dr
- 1348 Norwood Dr
- 409 Vicki Place
- 533 W Pleasantview Dr
- 525 W Pleasantview Dr
- 528 Brookview Dr
- 524 Brookview Dr
- 532 Brookview Dr
- 528 W Pleasantview Dr
- 601 W Pleasantview Dr
- 521 W Pleasantview Dr
- 524 W Pleasantview Dr
- 532 W Pleasantview Dr
- 600 Brookview Dr
- 520 Brookview Dr
- 600 W Pleasantview Dr
- 520 W Pleasantview Dr
- 605 W Pleasantview Dr
- 604 Brookview Dr
- 529 Brookview Dr
- 529 Circleview Dr S
- 525 Circleview Dr S
- 525 Brookview Dr