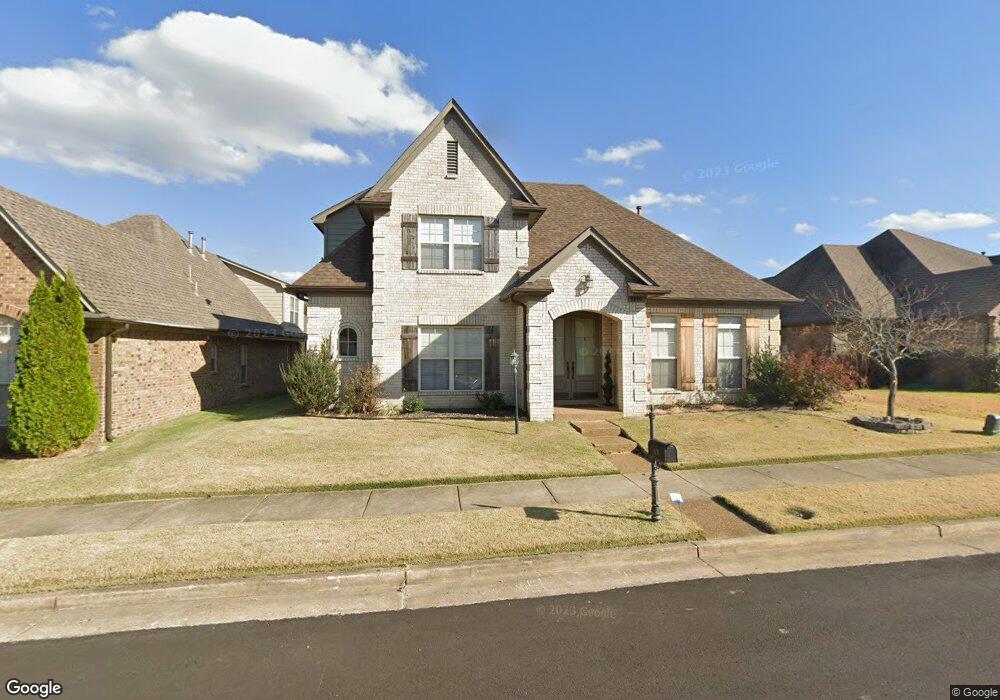
5290 Spruce View Way Lakeland, TN 38002
Estimated Value: $343,000 - $425,000
4
Beds
3
Baths
2,373
Sq Ft
$166/Sq Ft
Est. Value
About This Home
This home is located at 5290 Spruce View Way, Lakeland, TN 38002 and is currently estimated at $392,815, approximately $165 per square foot. 5290 Spruce View Way is a home located in Shelby County with nearby schools including Lakeland Elementary School, Lakeland Middle Preparatory School, and Arlington High School.
Ownership History
Date
Name
Owned For
Owner Type
Purchase Details
Closed on
Aug 23, 2017
Sold by
Moore Gregory
Bought by
Moore Kimberly J
Current Estimated Value
Purchase Details
Closed on
Jan 27, 2016
Sold by
Raburn Jerry L and Raburn Peggy
Bought by
Moore Kimberly J and Moore Gregory
Home Financials for this Owner
Home Financials are based on the most recent Mortgage that was taken out on this home.
Original Mortgage
$196,377
Outstanding Balance
$154,850
Interest Rate
3.62%
Mortgage Type
FHA
Estimated Equity
$237,965
Purchase Details
Closed on
May 29, 2009
Sold by
Creekside Homes Llc
Bought by
Raburn Jerry L and Raburn Peggy
Home Financials for this Owner
Home Financials are based on the most recent Mortgage that was taken out on this home.
Original Mortgage
$185,520
Interest Rate
4.77%
Mortgage Type
Purchase Money Mortgage
Create a Home Valuation Report for This Property
The Home Valuation Report is an in-depth analysis detailing your home's value as well as a comparison with similar homes in the area
Home Values in the Area
Average Home Value in this Area
Purchase History
| Date | Buyer | Sale Price | Title Company |
|---|---|---|---|
| Moore Kimberly J | -- | None Available | |
| Moore Kimberly J | $200,000 | Edco Title & Closing Svcs In | |
| Raburn Jerry L | $231,900 | Erickson Title & Closing Llc |
Source: Public Records
Mortgage History
| Date | Status | Borrower | Loan Amount |
|---|---|---|---|
| Open | Moore Kimberly J | $196,377 | |
| Previous Owner | Raburn Jerry L | $185,520 |
Source: Public Records
Tax History Compared to Growth
Tax History
| Year | Tax Paid | Tax Assessment Tax Assessment Total Assessment is a certain percentage of the fair market value that is determined by local assessors to be the total taxable value of land and additions on the property. | Land | Improvement |
|---|---|---|---|---|
| 2025 | $4,587 | $94,800 | $20,700 | $74,100 |
| 2024 | $4,587 | $67,650 | $13,800 | $53,850 |
| 2023 | $2,293 | $67,650 | $13,800 | $53,850 |
| 2022 | $2,293 | $67,650 | $13,800 | $53,850 |
| 2021 | $2,334 | $67,650 | $13,800 | $53,850 |
| 2020 | $2,167 | $53,500 | $15,600 | $37,900 |
| 2019 | $2,167 | $53,500 | $15,600 | $37,900 |
| 2018 | $2,836 | $53,500 | $15,600 | $37,900 |
| 2017 | $2,868 | $53,500 | $15,600 | $37,900 |
| 2016 | $3,120 | $54,075 | $0 | $0 |
| 2014 | $2,363 | $54,075 | $0 | $0 |
Source: Public Records
Map
Nearby Homes
- 10254 Evergreen Manor Cove
- 10249 Evergreen Manor Cove
- 0 Hampton Meadow Ln Unit 10188771
- 10188 Kaitlynn Rose Dr S
- 5224 Saffron Spring Dr
- 5338 May Grove Ln
- Reed Plan at Lakeland - Kensington Manor
- Graham Plan at Lakeland - Kensington Manor
- Carrington Plan at Lakeland - Kensington Manor
- Garland Plan at Lakeland - Kensington Manor
- Bailey Plan at Lakeland - Kensington Manor
- Crosby Plan at Lakeland - Kensington Manor
- Abbott Plan at Lakeland - Kensington Manor
- 5326 May Grove Ln
- 10178 Hampton Dr
- 10155 Conner Field Ln
- 10199 U S 70
- 5372 Kaitlynn Rose Dr W
- 5375 Kaitlynn Rose Ln
- 5208 Prairie Sky Dr
- 5296 Spruce View Way
- 5282 Spruce View Way
- 0 Spruce View Ln Unit 3181965
- 5302 Spruce View Way
- 10386 Loblolly View Ln
- 5291 Spruce View Way
- 5285 Spruce View Way
- 10394 Loblolly View Ln
- 5297 Spruce View Way
- 5308 Spruce View Way
- 5303 Spruce View Way
- 5279 Spruce View Way
- 10379 Loblolly View Ln
- 10385 Loblolly View Ln
- 10373 Loblolly View Ln
- 10383 Old Brownsville Rd
- 10398 Loblolly View Ln
- 5273 Spruce View Way
- 10391 Loblolly View Ln
- 5314 Spruce View Way