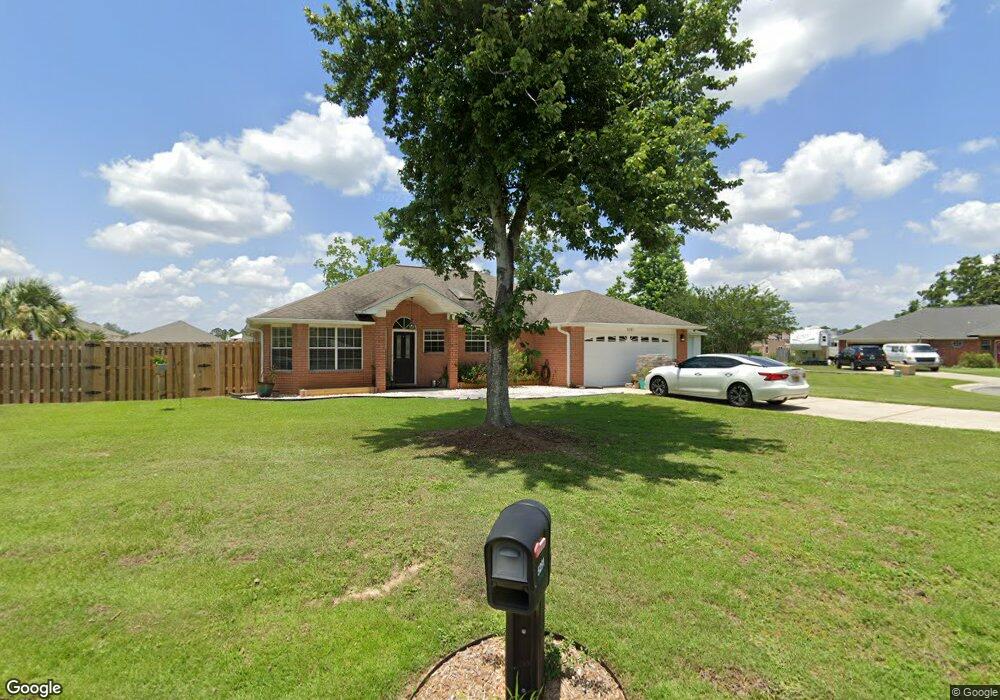
5291 Deer Creek Dr Milton, FL 32571
Estimated Value: $296,000 - $320,410
3
Beds
2
Baths
1,793
Sq Ft
$172/Sq Ft
Est. Value
About This Home
This home is located at 5291 Deer Creek Dr, Milton, FL 32571 and is currently estimated at $308,103, approximately $171 per square foot. 5291 Deer Creek Dr is a home located in Santa Rosa County with nearby schools including S.S. Dixon Primary School, S.S. Dixon Intermediate School, and Thomas L. Sims Middle School.
Ownership History
Date
Name
Owned For
Owner Type
Purchase Details
Closed on
May 20, 2016
Sold by
Way James E and Way Nancy J
Bought by
Howard Heather
Current Estimated Value
Home Financials for this Owner
Home Financials are based on the most recent Mortgage that was taken out on this home.
Original Mortgage
$180,000
Outstanding Balance
$142,965
Interest Rate
3.59%
Mortgage Type
New Conventional
Estimated Equity
$165,138
Purchase Details
Closed on
Jan 17, 2001
Sold by
Way James E and Kroll Nancy J
Bought by
Way J E and Kroll Nancy J
Purchase Details
Closed on
Jun 1, 2000
Sold by
Pare Daniel J and Pare Dolores A
Bought by
Way James E and Kroll Nancy J
Home Financials for this Owner
Home Financials are based on the most recent Mortgage that was taken out on this home.
Original Mortgage
$90,400
Interest Rate
8.14%
Purchase Details
Closed on
May 16, 1995
Sold by
Henry Co Homes Inc
Bought by
Pare Daniel J and Pare Dolores A
Create a Home Valuation Report for This Property
The Home Valuation Report is an in-depth analysis detailing your home's value as well as a comparison with similar homes in the area
Home Values in the Area
Average Home Value in this Area
Purchase History
| Date | Buyer | Sale Price | Title Company |
|---|---|---|---|
| Howard Heather | $180,000 | First International Title, I | |
| Way J E | -- | -- | |
| Way James E | $113,000 | -- | |
| Pare Daniel J | $91,900 | -- |
Source: Public Records
Mortgage History
| Date | Status | Borrower | Loan Amount |
|---|---|---|---|
| Open | Howard Heather | $180,000 | |
| Previous Owner | Way James E | $90,400 |
Source: Public Records
Tax History Compared to Growth
Tax History
| Year | Tax Paid | Tax Assessment Tax Assessment Total Assessment is a certain percentage of the fair market value that is determined by local assessors to be the total taxable value of land and additions on the property. | Land | Improvement |
|---|---|---|---|---|
| 2024 | $1,526 | $160,785 | -- | -- |
| 2023 | $1,526 | $156,102 | $0 | $0 |
| 2022 | $1,481 | $151,555 | $0 | $0 |
| 2021 | $1,460 | $147,141 | $0 | $0 |
| 2020 | $1,450 | $145,109 | $0 | $0 |
| 2019 | $1,410 | $141,847 | $0 | $0 |
| 2018 | $1,421 | $139,202 | $0 | $0 |
| 2017 | $1,347 | $136,339 | $0 | $0 |
| 2016 | $1,646 | $120,353 | $0 | $0 |
| 2015 | $1,629 | $115,789 | $0 | $0 |
| 2014 | $1,689 | $118,137 | $0 | $0 |
Source: Public Records
Map
Nearby Homes
- 5329 Talon Rd
- 5219 Chumuckla Hwy
- 3708 Lone Fox Ct
- 5282 Parkside Dr
- 5375 Red Shoulder Rd
- 3674 Hawks Landing Cir
- 3460 Edinburgh Dr
- 5468 Madelines Way
- 3457 Argyle Dr
- 3453 Argyle Dr
- 5045 Braxton Ln
- 00 Tilubo Ln
- 5541 Cane Syrup Cir
- 5468 Turbine Way
- 5329 Sussex Ln
- 5453 Hamilton Ln
- 3907 Elevator Ct
- 5607 Cane Syrup Cir
- 5128 Rowe Trail
- 5055 Serry Ln
- 5285 Conservation Cir
- 5286 Deer Creek Dr
- 5299 Deer Creek Ct
- 5281 Conservation Cir
- 5285 Deer Creek Dr
- 5292 Deer Creek Ct
- 5269 Conservation Cir
- 5298 Deer Creek Ct
- 5289 Chumuckla Hwy
- 5280 Deer Creek Dr
- 3712 Deer Creek Terrace
- 5301 Conservation Cir
- 5288 Conservation Cir
- 5284 Conservation Cir
- 5281 Chumuckla Hwy
- 5305 Conservation Cir
- 3706 Deer Creek Terrace
- 5274 Deer Creek Dr
- 5277 Conservation Cir
- 5289 Conservation Cir