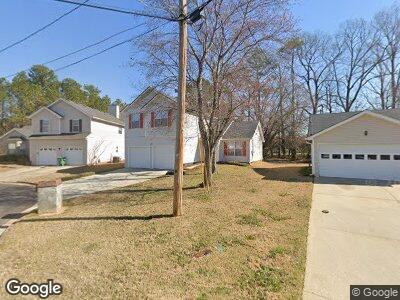
5292 Salem Springs Place Lithonia, GA 30038
Lithonia NeighborhoodEstimated Value: $236,000 - $256,824
3
Beds
3
Baths
1,682
Sq Ft
$147/Sq Ft
Est. Value
About This Home
This home is located at 5292 Salem Springs Place, Lithonia, GA 30038 and is currently estimated at $246,706, approximately $146 per square foot. 5292 Salem Springs Place is a home located in DeKalb County with nearby schools including Flat Rock Elementary School, Salem Middle School, and Martin Luther King- Jr. High School.
Ownership History
Date
Name
Owned For
Owner Type
Purchase Details
Closed on
Sep 22, 2022
Sold by
Opendoor Property Trust I
Bought by
Wrpv Xiv Sfr Owner I Llc
Current Estimated Value
Purchase Details
Closed on
Aug 31, 2022
Sold by
Jenkins Lesley L
Bought by
Opendoor Property J Llc
Purchase Details
Closed on
Nov 21, 2007
Sold by
Us Bank Na
Bought by
Jenkins Lesley L
Home Financials for this Owner
Home Financials are based on the most recent Mortgage that was taken out on this home.
Original Mortgage
$108,000
Interest Rate
6.36%
Mortgage Type
New Conventional
Purchase Details
Closed on
Jul 3, 2007
Sold by
Freeman Eric and Freeman Natasha
Bought by
Us Bank Na
Purchase Details
Closed on
May 28, 1999
Sold by
Marbut Realty & Investment Co In
Bought by
Todd Natasha L
Home Financials for this Owner
Home Financials are based on the most recent Mortgage that was taken out on this home.
Original Mortgage
$99,700
Interest Rate
6.94%
Mortgage Type
FHA
Create a Home Valuation Report for This Property
The Home Valuation Report is an in-depth analysis detailing your home's value as well as a comparison with similar homes in the area
Home Values in the Area
Average Home Value in this Area
Purchase History
| Date | Buyer | Sale Price | Title Company |
|---|---|---|---|
| Wrpv Xiv Sfr Owner I Llc | $214,130 | -- | |
| Opendoor Property J Llc | $200,600 | -- | |
| Jenkins Lesley L | $108,000 | -- | |
| Us Bank Na | $114,750 | -- | |
| Todd Natasha L | $99,900 | -- |
Source: Public Records
Mortgage History
| Date | Status | Borrower | Loan Amount |
|---|---|---|---|
| Previous Owner | Jenkins Lesley L | $108,000 | |
| Previous Owner | Freeman Eric | $30,000 | |
| Previous Owner | Todd Natasha L | $99,700 |
Source: Public Records
Tax History Compared to Growth
Tax History
| Year | Tax Paid | Tax Assessment Tax Assessment Total Assessment is a certain percentage of the fair market value that is determined by local assessors to be the total taxable value of land and additions on the property. | Land | Improvement |
|---|---|---|---|---|
| 2023 | $4,940 | $95,200 | $15,200 | $80,000 |
| 2022 | $2,407 | $84,040 | $8,360 | $75,680 |
| 2021 | $1,960 | $63,640 | $8,360 | $55,280 |
| 2020 | $1,686 | $52,520 | $6,840 | $45,680 |
| 2019 | $1,665 | $50,720 | $6,840 | $43,880 |
| 2018 | $1,278 | $42,800 | $4,240 | $38,560 |
| 2017 | $1,204 | $35,880 | $4,240 | $31,640 |
| 2016 | $1,167 | $35,600 | $4,240 | $31,360 |
| 2014 | $1,014 | $31,120 | $4,240 | $26,880 |
Source: Public Records
Map
Nearby Homes
- 5246 Salem Springs Place
- 3636 Salem Glen Rd Unit 1A
- 3649 Salem Glen Rd
- 5233 Walnut Ct
- 5480 Walnut Ln
- 5080 Springtree Ct
- 3512 Valley Chase Ct
- 5407 Effingham Ct
- 3852 Panola Rd
- 5326 Rocky Pine Dr
- 3448 Great Meadows Ct
- 5090 Great Meadows Rd
- 3961 Panola Rd
- 5364 Cedar Rock Dr
- 4974 Browns Mill Rd
- 5074 Great Meadows Rd
- 4954 Browns Mill Rd
- 5292 Salem Springs Place
- 5296 Salem Springs Place
- 5288 Salem Springs Place
- 5288 Salem Springs Place Unit III
- 5300 Salem Springs Place
- 5304 Salem Springs Place
- 5289 Salem Springs Place
- 5280 Salem Springs Place
- 5301 Salem Springs Place
- 5308 Salem Springs Place
- 5274 Salem Springs Place
- 5305 Salem Springs Place
- 3602 Salem Hills Dr
- 3606 Salem Hills Dr
- 5312 Salem Springs Place
- 5270 Salem Springs Place
- 5309 Salem Springs Place
- 3610 Salem Hills Dr
- 3582 Salem Hills Dr
- 3614 Salem Hills Dr