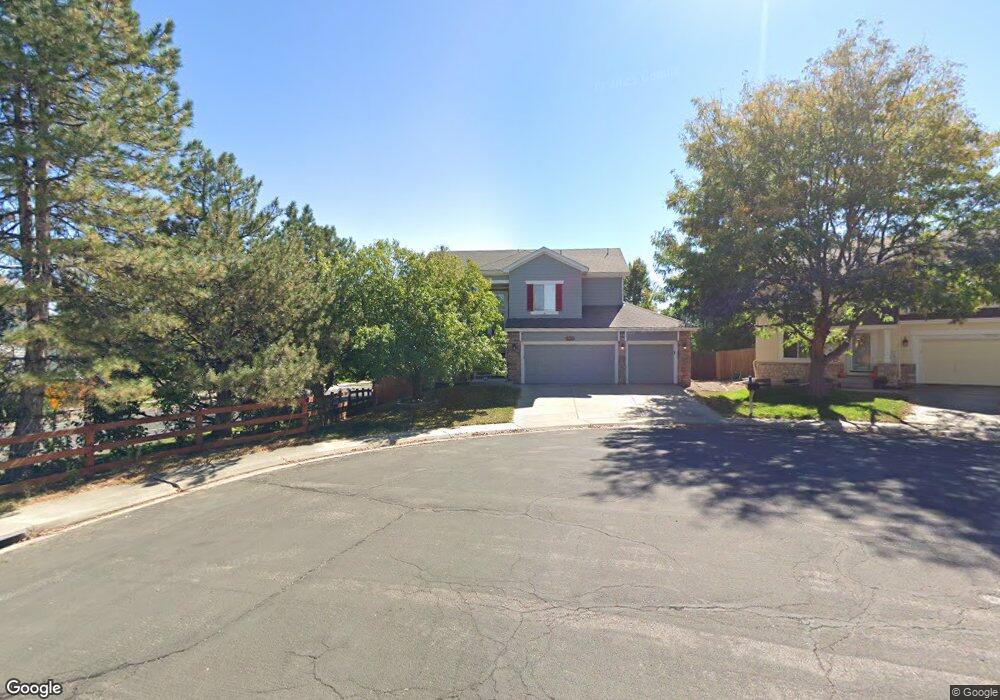
5296 E 130th Cir Thornton, CO 80241
Estimated Value: $560,000 - $613,000
3
Beds
3
Baths
1,803
Sq Ft
$324/Sq Ft
Est. Value
About This Home
This home is located at 5296 E 130th Cir, Thornton, CO 80241 and is currently estimated at $585,068, approximately $324 per square foot. 5296 E 130th Cir is a home located in Adams County with nearby schools including Eagleview Elementary School, Rocky Top Middle School, and Horizon High School.
Ownership History
Date
Name
Owned For
Owner Type
Purchase Details
Closed on
Jun 7, 2021
Sold by
Goff Kimberly J and Goff Russell
Bought by
Erickson Kevin Richard and Erickson Lora Lee
Current Estimated Value
Home Financials for this Owner
Home Financials are based on the most recent Mortgage that was taken out on this home.
Original Mortgage
$508,250
Outstanding Balance
$456,129
Interest Rate
2.9%
Mortgage Type
New Conventional
Estimated Equity
$128,939
Purchase Details
Closed on
Mar 4, 2005
Sold by
Hanson Kimberly J
Bought by
Goff Kimberly J and Goff Russell
Home Financials for this Owner
Home Financials are based on the most recent Mortgage that was taken out on this home.
Original Mortgage
$16,000
Interest Rate
5.71%
Mortgage Type
Stand Alone Second
Purchase Details
Closed on
Oct 24, 2001
Sold by
Hanson Kimerly J and Hanson Kimberly J
Bought by
Hanson Kimberly J
Home Financials for this Owner
Home Financials are based on the most recent Mortgage that was taken out on this home.
Original Mortgage
$171,100
Interest Rate
6.77%
Create a Home Valuation Report for This Property
The Home Valuation Report is an in-depth analysis detailing your home's value as well as a comparison with similar homes in the area
Purchase History
| Date | Buyer | Sale Price | Title Company |
|---|---|---|---|
| Erickson Kevin Richard | $550,000 | Land Title Guarantee | |
| Goff Kimberly J | -- | Security Title | |
| Hanson Kimberly J | -- | -- | |
| Hanson Kimerly J | -- | -- |
Source: Public Records
Mortgage History
| Date | Status | Borrower | Loan Amount |
|---|---|---|---|
| Open | Erickson Kevin Richard | $508,250 | |
| Previous Owner | Goff Kimberly J | $16,000 | |
| Previous Owner | Hanson Kimberly J | $171,100 |
Source: Public Records
Tax History
| Year | Tax Paid | Tax Assessment Tax Assessment Total Assessment is a certain percentage of the fair market value that is determined by local assessors to be the total taxable value of land and additions on the property. | Land | Improvement |
|---|---|---|---|---|
| 2025 | $3,733 | $38,420 | $9,320 | $29,100 |
| 2024 | $3,733 | $35,310 | $8,560 | $26,750 |
| 2023 | $3,695 | $39,780 | $6,830 | $32,950 |
| 2022 | $3,159 | $28,680 | $7,020 | $21,660 |
| 2021 | $3,264 | $28,680 | $7,020 | $21,660 |
| 2020 | $3,072 | $27,540 | $7,220 | $20,320 |
| 2019 | $3,079 | $27,540 | $7,220 | $20,320 |
| 2018 | $2,804 | $24,370 | $6,840 | $17,530 |
| 2017 | $2,550 | $24,370 | $6,840 | $17,530 |
| 2016 | $2,126 | $19,780 | $4,220 | $15,560 |
| 2015 | $2,123 | $19,780 | $4,220 | $15,560 |
| 2014 | $2,054 | $18,610 | $3,660 | $14,950 |
Source: Public Records
Map
Nearby Homes
- 5341 E 129th Way
- 13271 Holly St Unit B
- 4756 E 129th Place
- 5375 E 128th Dr
- 5628 Hudson Cir
- 5024 E 127th Way
- 13222 Clermont Cir
- 13212 Clermont Cir
- 12993 Birch Dr
- 13190 Kearney St
- 12870 Jasmine St Unit A
- 12767 Ivanhoe St
- 12792 Ivy St
- 12791 Clermont St
- 12698 Fairfax St
- 12770 Ivanhoe St
- 12768 Ivanhoe St
- 12884 Jasmine St Unit C
- 13349 Krameria St
- 12856 Jasmine St Unit B
- 5290 E 130th Cir
- 5293 E 130th Way
- 5284 E 130th Cir
- 5305 E 130th Place
- 5299 E 130th Way
- 5287 E 130th Way
- 5306 E 130th Place
- 5281 E 130th Way
- 5278 E 130th Cir
- 5313 E 130th Place
- 5297 E 131st Dr
- 5297 E 130th Cir
- 5314 E 130th Place
- 5275 E 130th Way
- 5303 E 130th Way
- 5285 E 130th Cir
- 5272 E 130th Cir
- 5321 E 130th Place
- 5326 E 130th Place
- 5293 E 131st Dr
Your Personal Tour Guide
Ask me questions while you tour the home.