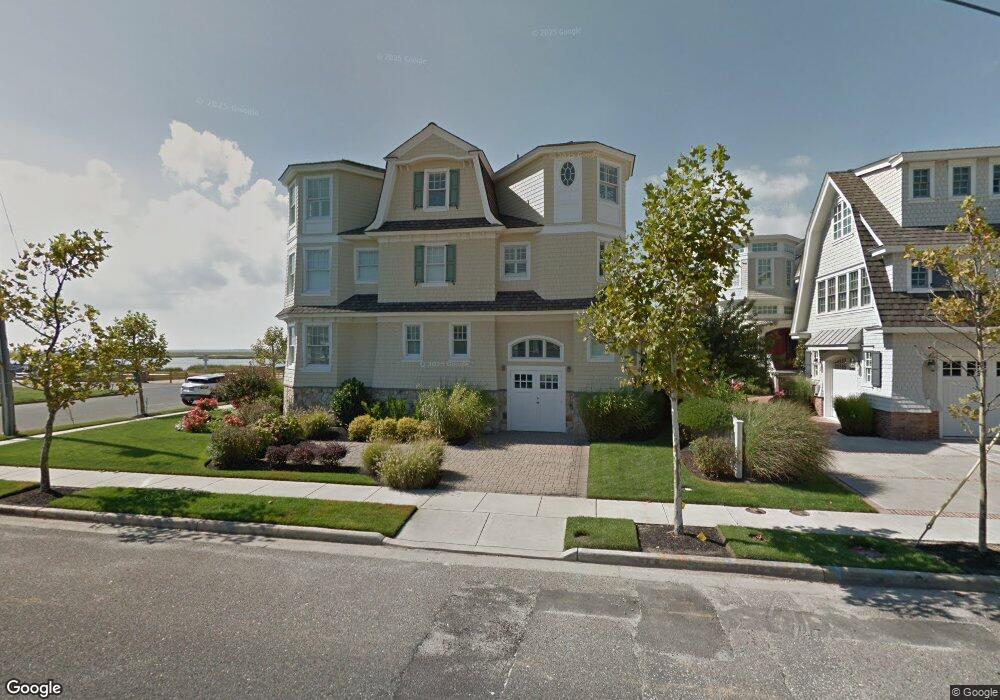
5298 Ocean Dr Avalon, NJ 08202
Estimated Value: $4,483,756 - $5,948,000
--
Bed
--
Bath
4,225
Sq Ft
$1,216/Sq Ft
Est. Value
About This Home
This home is located at 5298 Ocean Dr, Avalon, NJ 08202 and is currently estimated at $5,136,939, approximately $1,215 per square foot. 5298 Ocean Dr is a home located in Cape May County with nearby schools including Avalon Elementary School.
Ownership History
Date
Name
Owned For
Owner Type
Purchase Details
Closed on
Aug 24, 2012
Sold by
Scardino Frank G and Scardino Anne C
Bought by
Murphy Patrick and Murphy Kim
Current Estimated Value
Home Financials for this Owner
Home Financials are based on the most recent Mortgage that was taken out on this home.
Original Mortgage
$1,200,000
Outstanding Balance
$515,766
Interest Rate
3.62%
Mortgage Type
New Conventional
Estimated Equity
$4,621,173
Purchase Details
Closed on
Sep 30, 2004
Sold by
Walsh Joan D
Bought by
Scardino Frank G and Scardino Anne C
Home Financials for this Owner
Home Financials are based on the most recent Mortgage that was taken out on this home.
Original Mortgage
$1,140,000
Interest Rate
4.23%
Mortgage Type
Purchase Money Mortgage
Purchase Details
Closed on
Apr 1, 1989
Sold by
Walsh John
Bought by
Walsh Joan
Create a Home Valuation Report for This Property
The Home Valuation Report is an in-depth analysis detailing your home's value as well as a comparison with similar homes in the area
Home Values in the Area
Average Home Value in this Area
Purchase History
| Date | Buyer | Sale Price | Title Company |
|---|---|---|---|
| Murphy Patrick | $2,250,000 | None Available | |
| Scardino Frank G | $1,425,000 | -- | |
| Walsh Joan | -- | -- |
Source: Public Records
Mortgage History
| Date | Status | Borrower | Loan Amount |
|---|---|---|---|
| Open | Murphy Patrick | $1,200,000 | |
| Previous Owner | Scardino Frank G | $1,140,000 |
Source: Public Records
Tax History Compared to Growth
Tax History
| Year | Tax Paid | Tax Assessment Tax Assessment Total Assessment is a certain percentage of the fair market value that is determined by local assessors to be the total taxable value of land and additions on the property. | Land | Improvement |
|---|---|---|---|---|
| 2025 | $12,769 | $2,079,700 | $918,000 | $1,161,700 |
| 2024 | $12,769 | $2,079,700 | $918,000 | $1,161,700 |
| 2023 | $12,665 | $2,079,700 | $918,000 | $1,161,700 |
| 2022 | $11,813 | $2,079,700 | $918,000 | $1,161,700 |
| 2021 | $11,376 | $2,079,700 | $918,000 | $1,161,700 |
| 2020 | $10,939 | $2,079,700 | $918,000 | $1,161,700 |
| 2019 | $10,606 | $2,079,700 | $918,000 | $1,161,700 |
| 2018 | $10,149 | $2,079,700 | $918,000 | $1,161,700 |
| 2017 | $10,036 | $1,805,100 | $765,000 | $1,040,100 |
| 2016 | $9,928 | $1,805,100 | $765,000 | $1,040,100 |
| 2015 | $9,766 | $1,805,100 | $765,000 | $1,040,100 |
| 2014 | $9,657 | $1,805,100 | $765,000 | $1,040,100 |
Source: Public Records
Map
Nearby Homes