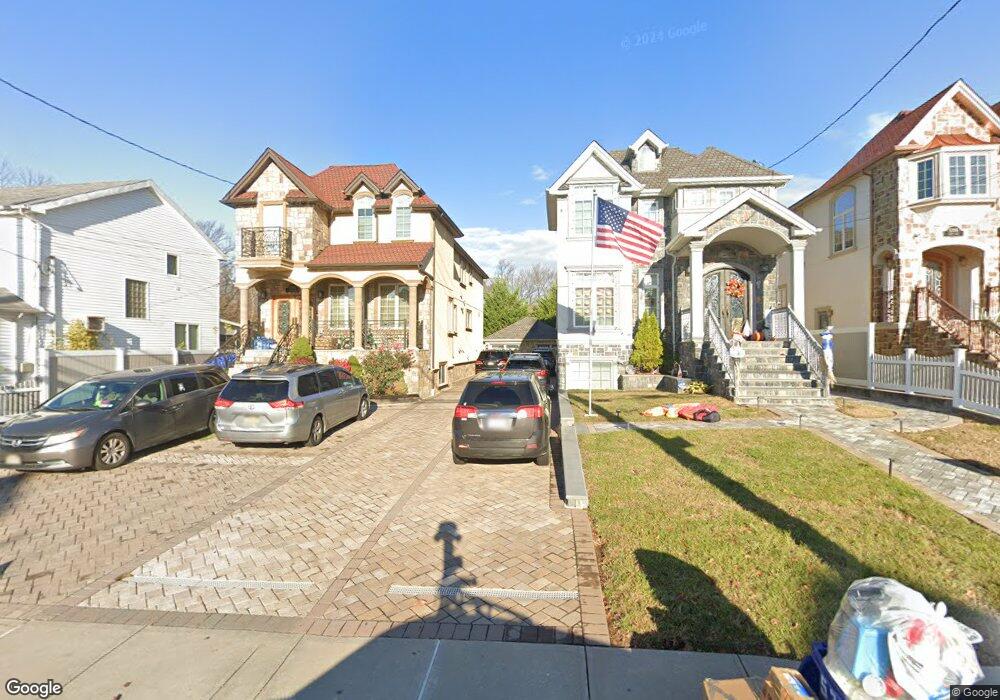
5299-5301 Amboy Rd Staten Island, NY 10312
Huguenot NeighborhoodEstimated Value: $1,478,000 - $1,640,549
--
Bed
--
Bath
3,274
Sq Ft
$484/Sq Ft
Est. Value
About This Home
This home is located at 5299-5301 Amboy Rd, Staten Island, NY 10312 and is currently estimated at $1,586,183, approximately $484 per square foot. 5299-5301 Amboy Rd is a home located in Richmond County with nearby schools including P.S. 36 - J.C. Drumgoole, I.S. 007 Elias Bernstein, and Tottenville High School.
Ownership History
Date
Name
Owned For
Owner Type
Purchase Details
Closed on
Dec 15, 2020
Sold by
Cheung Sing
Bought by
Cheung Sing and Cheung Nam
Current Estimated Value
Purchase Details
Closed on
Jul 10, 2017
Sold by
Cee Lay Real Estate Development Corp
Bought by
Cheung Sing
Home Financials for this Owner
Home Financials are based on the most recent Mortgage that was taken out on this home.
Original Mortgage
$735,000
Interest Rate
3.96%
Mortgage Type
Commercial
Purchase Details
Closed on
Jun 11, 2013
Sold by
Sindle James H and Sindle Veronica J
Bought by
Cee Jay Real Estate Development Corp
Home Financials for this Owner
Home Financials are based on the most recent Mortgage that was taken out on this home.
Original Mortgage
$500,000
Interest Rate
12%
Mortgage Type
Purchase Money Mortgage
Create a Home Valuation Report for This Property
The Home Valuation Report is an in-depth analysis detailing your home's value as well as a comparison with similar homes in the area
Home Values in the Area
Average Home Value in this Area
Purchase History
| Date | Buyer | Sale Price | Title Company |
|---|---|---|---|
| Cheung Sing | -- | Jewett Abstract | |
| Cheung Sing | $997,885 | None Available | |
| Cee Jay Real Estate Development Corp | $650,000 | None Available |
Source: Public Records
Mortgage History
| Date | Status | Borrower | Loan Amount |
|---|---|---|---|
| Previous Owner | Cheung Sing | $735,000 | |
| Previous Owner | Cee Jay Real Estate Development Corp | $500,000 |
Source: Public Records
Tax History Compared to Growth
Tax History
| Year | Tax Paid | Tax Assessment Tax Assessment Total Assessment is a certain percentage of the fair market value that is determined by local assessors to be the total taxable value of land and additions on the property. | Land | Improvement |
|---|---|---|---|---|
| 2025 | $13,424 | $105,300 | $11,182 | $94,118 |
| 2024 | $13,424 | $86,040 | $12,910 | $73,130 |
| 2023 | $13,574 | $66,836 | $12,910 | $53,926 |
| 2022 | $12,730 | $74,220 | $16,620 | $57,600 |
| 2021 | $12,785 | $61,980 | $16,620 | $45,360 |
| 2020 | $12,497 | $68,520 | $16,620 | $51,900 |
| 2019 | $11,651 | $63,360 | $16,620 | $46,740 |
| 2018 | $11,354 | $55,697 | $15,537 | $40,160 |
| 2017 | $8,488 | $41,640 | $12,480 | $29,160 |
| 2016 | $17,721 | $76,212 | $30,312 | $45,900 |
| 2015 | $7,093 | $39,177 | $39,177 | $0 |
| 2014 | $7,093 | $36,960 | $22,920 | $14,040 |
Source: Public Records
Map
Nearby Homes
- 5300 Amboy Rd
- 267 Bennett Ave
- 76 Stecher St
- 274 S Railroad St
- 5434 Amboy Rd
- 163 Bennett Ave
- 218 Albee Ave
- 374 Billiou St
- 50 Buffington Ave
- 76 Downes Ave
- 164 N Railroad St
- 488 Ionia Ave
- 172 N Railroad St
- 26 Buffington Ave
- 0 Ionia Ave
- 382 Edgegrove Ave
- 8 Poillon Ave
- 694 Edgegrove Ave Unit 715
- 728 Huguenot Ave
- 50 Poillon Ave
- 5301 Amboy Rd
- 5299 Amboy Rd
- 5303 Amboy Rd
- 5295 Amboy Rd
- 5309 Amboy Rd
- 5291 Amboy Rd Unit 1A
- 5291 Amboy Rd Unit B
- 5291 Amboy Rd Unit A
- 142 Collyer Ave
- 130 Collyer Ave
- 5281 Amboy Rd
- 150 Collyer Ave
- 5304 Amboy Rd
- 5308 Amboy Rd
- 7 Rose Ln
- 5296 Amboy Rd
- 5275 Amboy Rd
- 11 Rose Ln
- 10 Arbutus Ave
- 114 Collyer Ave