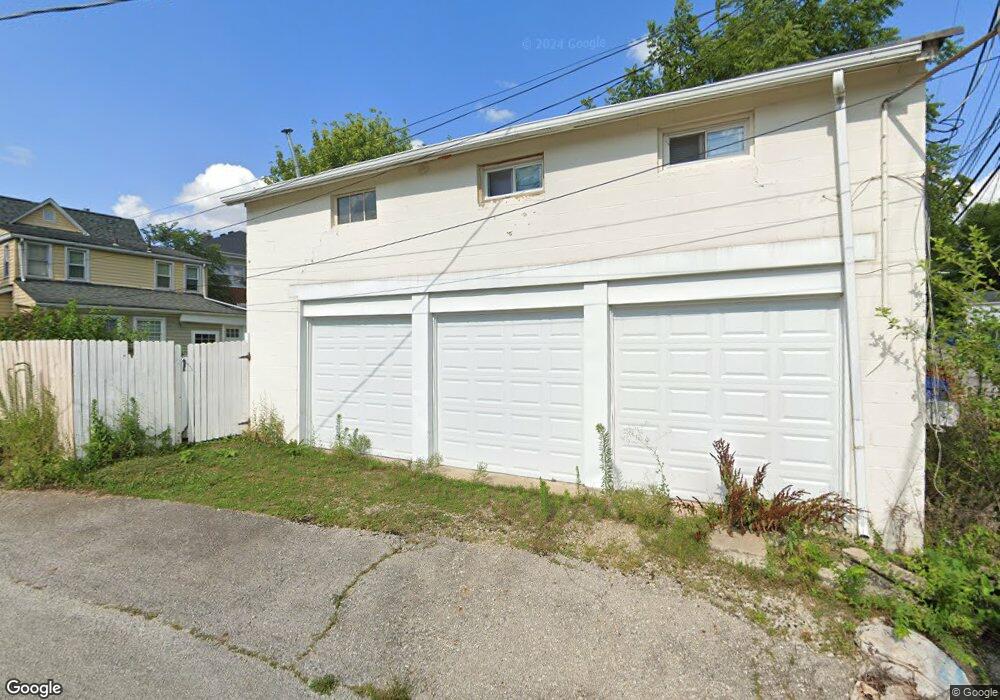
53-53 1/2 E Como Ave Columbus, OH 43202
Clintonville NeighborhoodEstimated Value: $458,000 - $613,000
4
Beds
2
Baths
2,583
Sq Ft
$199/Sq Ft
Est. Value
About This Home
This home is located at 53-53 1/2 E Como Ave, Columbus, OH 43202 and is currently estimated at $512,825, approximately $198 per square foot. 53-53 1/2 E Como Ave is a home located in Franklin County with nearby schools including Clinton Elementary School, Dominion Middle School, and Whetstone High School.
Ownership History
Date
Name
Owned For
Owner Type
Purchase Details
Closed on
Dec 1, 2021
Sold by
M Property Holdings Llc
Bought by
M Development Llc
Current Estimated Value
Purchase Details
Closed on
Sep 5, 2019
Sold by
Smiley Tiffany L and Mustric Family Irrevocable Tru
Bought by
M Property Holdings Llc
Purchase Details
Closed on
Jul 5, 2019
Sold by
Woods Michael J and Woods Laurel R
Bought by
Smiley Tiffany and The Mustric Family Irrevocable
Purchase Details
Closed on
May 22, 2003
Sold by
Clinger Ronda W and Clinger Gary A
Bought by
Woods Michael J and Woods Laurel R
Home Financials for this Owner
Home Financials are based on the most recent Mortgage that was taken out on this home.
Original Mortgage
$168,800
Interest Rate
5.88%
Mortgage Type
Purchase Money Mortgage
Purchase Details
Closed on
Apr 7, 1998
Sold by
Mcclain Jay E and Mcclain Ronda W
Bought by
Mcclain Ronda W
Purchase Details
Closed on
Sep 28, 1990
Purchase Details
Closed on
Dec 1, 1980
Create a Home Valuation Report for This Property
The Home Valuation Report is an in-depth analysis detailing your home's value as well as a comparison with similar homes in the area
Home Values in the Area
Average Home Value in this Area
Purchase History
| Date | Buyer | Sale Price | Title Company |
|---|---|---|---|
| M Development Llc | $433,000 | Transcounty Title Agency Llc | |
| M Property Holdings Llc | -- | None Available | |
| Smiley Tiffany | $358,500 | None Available | |
| Woods Michael J | $211,000 | -- | |
| Mcclain Ronda W | -- | -- | |
| -- | $83,500 | -- | |
| -- | $54,000 | -- |
Source: Public Records
Mortgage History
| Date | Status | Borrower | Loan Amount |
|---|---|---|---|
| Previous Owner | Woods Michael J | $168,800 |
Source: Public Records
Tax History
| Year | Tax Paid | Tax Assessment Tax Assessment Total Assessment is a certain percentage of the fair market value that is determined by local assessors to be the total taxable value of land and additions on the property. | Land | Improvement |
|---|---|---|---|---|
| 2025 | $7,032 | $153,440 | $43,260 | $110,180 |
| 2024 | $7,032 | $153,440 | $43,260 | $110,180 |
| 2023 | $6,944 | $153,440 | $43,260 | $110,180 |
| 2022 | $10,009 | $125,480 | $18,450 | $107,030 |
| 2021 | $6,680 | $125,480 | $18,450 | $107,030 |
| 2020 | $6,582 | $123,450 | $23,940 | $99,510 |
| 2019 | $5,130 | $83,520 | $18,450 | $65,070 |
| 2018 | $4,910 | $83,520 | $18,450 | $65,070 |
| 2017 | $5,128 | $83,520 | $18,450 | $65,070 |
| 2016 | $5,169 | $77,040 | $20,440 | $56,600 |
| 2015 | $4,699 | $77,040 | $20,440 | $56,600 |
| 2014 | $4,710 | $77,040 | $20,440 | $56,600 |
| 2013 | $2,295 | $76,090 | $19,495 | $56,595 |
Source: Public Records
Map
Nearby Homes
- 83 Clinton Heights Ave
- 99 E Pacemont Rd
- 44 W Pacemont Rd
- 45 E California Ave
- 84-86 W Como Ave
- 10 E Weber Rd Unit 402
- 270 Clinton Heights Ave
- 123 W Como Ave
- 3021 N High St
- 94 W Tulane Rd
- 296 Walhalla Rd
- 29 Crestview Rd
- 27 E Dunedin Rd
- 116 E Dunedin Rd
- 231 W Pacemont Rd Unit 235
- 3052 Dorris Ave Unit 3052
- 367 E Dunedin Rd
- 30 E Torrence Rd
- 222 W North Broadway St
- 263 W North Broadway St
Your Personal Tour Guide
Ask me questions while you tour the home.