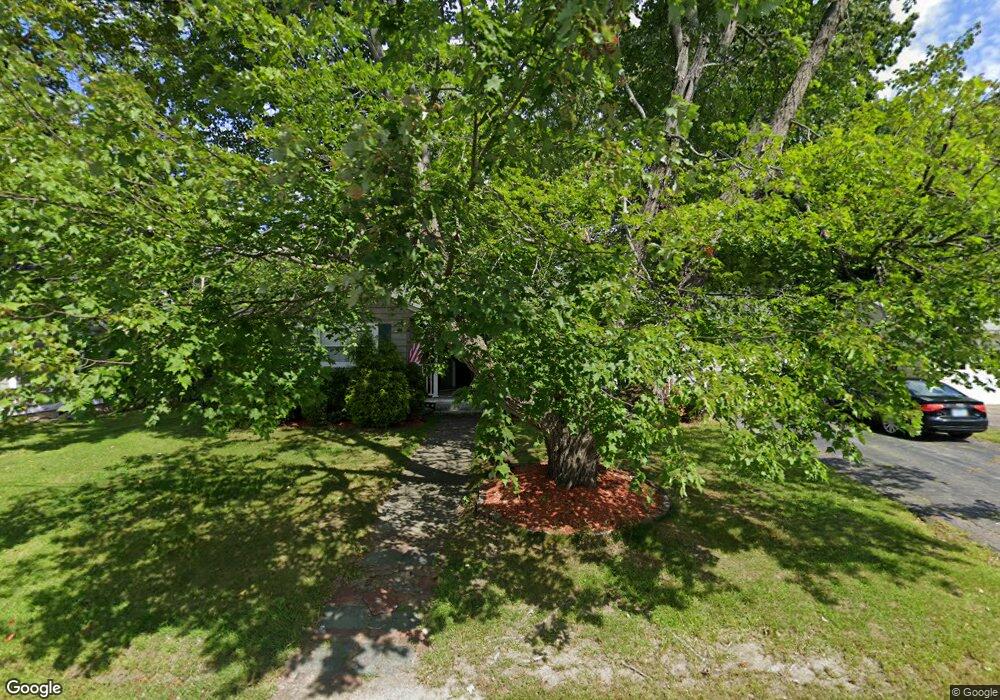
53 Atherton Ave Nashua, NH 03064
North End Nashua NeighborhoodEstimated Value: $481,987 - $653,000
3
Beds
2
Baths
1,618
Sq Ft
$335/Sq Ft
Est. Value
About This Home
This home is located at 53 Atherton Ave, Nashua, NH 03064 and is currently estimated at $542,247, approximately $335 per square foot. 53 Atherton Ave is a home located in Hillsborough County with nearby schools including Mount Pleasant Elementary School, Pennichuck Middle School, and Nashua High School North.
Ownership History
Date
Name
Owned For
Owner Type
Purchase Details
Closed on
Apr 26, 2021
Sold by
Casale Derek J and Casale Jessica E
Bought by
Casale Derek J
Current Estimated Value
Home Financials for this Owner
Home Financials are based on the most recent Mortgage that was taken out on this home.
Original Mortgage
$165,500
Outstanding Balance
$122,543
Interest Rate
2.3%
Mortgage Type
New Conventional
Estimated Equity
$419,704
Purchase Details
Closed on
Nov 13, 2009
Sold by
Fnma
Bought by
Casale Derek J
Home Financials for this Owner
Home Financials are based on the most recent Mortgage that was taken out on this home.
Original Mortgage
$216,625
Interest Rate
4.98%
Mortgage Type
Purchase Money Mortgage
Purchase Details
Closed on
Nov 3, 2009
Sold by
Fnma
Bought by
Nguyen Oanh and Nguyen Long
Home Financials for this Owner
Home Financials are based on the most recent Mortgage that was taken out on this home.
Original Mortgage
$216,625
Interest Rate
4.98%
Mortgage Type
Purchase Money Mortgage
Purchase Details
Closed on
Jul 15, 2009
Sold by
Mcfall Daniel and Fnma
Bought by
Federal National Mortgage Association
Purchase Details
Closed on
Apr 18, 2003
Sold by
Shalhoup Michael A and Shalhoup Barbara M
Bought by
Mcfall Daniel and Mcfall Amy
Create a Home Valuation Report for This Property
The Home Valuation Report is an in-depth analysis detailing your home's value as well as a comparison with similar homes in the area
Home Values in the Area
Average Home Value in this Area
Purchase History
| Date | Buyer | Sale Price | Title Company |
|---|---|---|---|
| Casale Derek J | -- | None Available | |
| Casale Derek J | -- | None Available | |
| Casale Derek J | $223,600 | -- | |
| Nguyen Oanh | $267,000 | -- | |
| Federal National Mortgage Association | $267,200 | -- | |
| Mcfall Daniel | $214,900 | -- | |
| Casale Derek J | $223,600 | -- | |
| Nguyen Oanh | $267,000 | -- | |
| Federal National Mortgage Association | $267,200 | -- | |
| Mcfall Daniel | $214,900 | -- |
Source: Public Records
Mortgage History
| Date | Status | Borrower | Loan Amount |
|---|---|---|---|
| Open | Casale Derek J | $165,500 | |
| Closed | Casale Derek J | $165,500 | |
| Previous Owner | Mcfall Daniel | $210,906 | |
| Previous Owner | Mcfall Daniel | $216,625 |
Source: Public Records
Tax History Compared to Growth
Tax History
| Year | Tax Paid | Tax Assessment Tax Assessment Total Assessment is a certain percentage of the fair market value that is determined by local assessors to be the total taxable value of land and additions on the property. | Land | Improvement |
|---|---|---|---|---|
| 2024 | $7,004 | $440,500 | $151,000 | $289,500 |
| 2023 | $6,679 | $366,400 | $120,800 | $245,600 |
| 2022 | $6,621 | $366,400 | $120,800 | $245,600 |
| 2021 | $5,733 | $246,900 | $80,500 | $166,400 |
| 2020 | $5,582 | $246,900 | $80,500 | $166,400 |
| 2019 | $5,373 | $246,900 | $80,500 | $166,400 |
| 2018 | $5,237 | $246,900 | $80,500 | $166,400 |
| 2017 | $4,890 | $189,600 | $76,700 | $112,900 |
| 2016 | $4,753 | $189,600 | $76,700 | $112,900 |
| 2015 | $4,651 | $189,600 | $76,700 | $112,900 |
| 2014 | $4,425 | $184,000 | $76,700 | $107,300 |
Source: Public Records
Map
Nearby Homes
- 19 Atherton Ave
- 15 Atherton Ave
- 46 Perham St Unit 214
- 13 Sapphire Ln
- 21 Edson St
- 9 Doveton Ln Unit B
- 71 Concord St
- 434 Abbott Farm Ln
- 312 Abbott Farm Ln
- 36-38 Courtland St
- 40B Brackett Ln
- 19 Bartlett Ave
- 27 Amanda Dr
- 1 Shoreline Dr Unit 16
- 4 Reservoir St
- 4 Chase St
- 11 Juliana Ave Unit 52
- 31 Juliana Ave
- 31 Juliana Ave Unit 4
- 12 Juliana Ave Unit 14