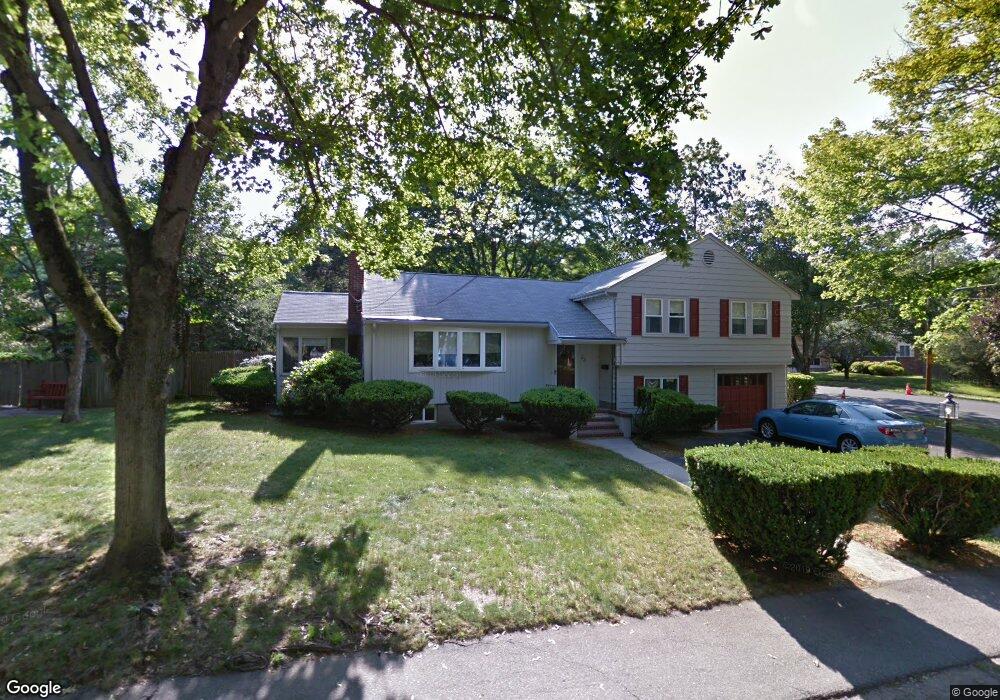
53 Bird St Needham, MA 02492
Estimated Value: $1,300,000 - $1,553,087
3
Beds
3
Baths
1,941
Sq Ft
$725/Sq Ft
Est. Value
About This Home
This home is located at 53 Bird St, Needham, MA 02492 and is currently estimated at $1,406,772, approximately $724 per square foot. 53 Bird St is a home located in Norfolk County with nearby schools including Broadmeadow Elementary School, High Rock Middle School, and Pollard Middle School.
Ownership History
Date
Name
Owned For
Owner Type
Purchase Details
Closed on
Apr 7, 2014
Sold by
Brosius J E and Brosius Claire J
Bought by
Claire J Brosius Ret and Brosius J E
Current Estimated Value
Purchase Details
Closed on
Oct 23, 1996
Sold by
Thomas James B and Thomas Joann E
Bought by
Brosius J Eric and Brosius Claire J
Home Financials for this Owner
Home Financials are based on the most recent Mortgage that was taken out on this home.
Original Mortgage
$248,000
Interest Rate
8.22%
Mortgage Type
Purchase Money Mortgage
Purchase Details
Closed on
Jul 15, 1993
Sold by
Dionne Alfred N and Dionne Joan
Bought by
Thomas James B and Thomas Joann E
Home Financials for this Owner
Home Financials are based on the most recent Mortgage that was taken out on this home.
Original Mortgage
$145,000
Interest Rate
7.4%
Mortgage Type
Purchase Money Mortgage
Create a Home Valuation Report for This Property
The Home Valuation Report is an in-depth analysis detailing your home's value as well as a comparison with similar homes in the area
Home Values in the Area
Average Home Value in this Area
Purchase History
| Date | Buyer | Sale Price | Title Company |
|---|---|---|---|
| Claire J Brosius Ret | -- | -- | |
| Brosius J Eric | $310,000 | -- | |
| Thomas James B | $245,000 | -- |
Source: Public Records
Mortgage History
| Date | Status | Borrower | Loan Amount |
|---|---|---|---|
| Previous Owner | Thomas James B | $200,000 | |
| Previous Owner | Thomas James B | $248,000 | |
| Previous Owner | Thomas James B | $145,000 |
Source: Public Records
Tax History
| Year | Tax Paid | Tax Assessment Tax Assessment Total Assessment is a certain percentage of the fair market value that is determined by local assessors to be the total taxable value of land and additions on the property. | Land | Improvement |
|---|---|---|---|---|
| 2025 | $13,121 | $1,237,800 | $800,400 | $437,400 |
| 2024 | $12,707 | $1,014,900 | $589,200 | $425,700 |
| 2023 | $12,837 | $984,400 | $589,200 | $395,200 |
| 2022 | $12,172 | $910,400 | $521,400 | $389,000 |
| 2021 | $11,863 | $910,400 | $521,400 | $389,000 |
| 2020 | $11,641 | $932,000 | $521,400 | $410,600 |
| 2019 | $9,994 | $806,600 | $474,000 | $332,600 |
| 2018 | $9,582 | $806,600 | $474,000 | $332,600 |
| 2017 | $9,079 | $763,600 | $474,000 | $289,600 |
| 2016 | $8,812 | $763,600 | $474,000 | $289,600 |
| 2015 | $8,621 | $763,600 | $474,000 | $289,600 |
| 2014 | $7,873 | $676,400 | $395,000 | $281,400 |
Source: Public Records
Map
Nearby Homes
- 103 Aletha Rd
- 883 Greendale Ave
- 176 Highgate St
- 31 Birds Hill Ave
- 68 Brookline St
- 60 Douglas Rd
- 190 Brookline St
- 28 Green St
- 126 Prince St
- 11 Holmes St
- 17 Lindbergh Ave
- 50 Sterling Rd
- 36 Otis St Unit 36
- 242 Valley Rd
- 1204 Greendale Ave Unit 128
- 1202 Greendale Ave Unit 124
- 674 Webster St
- 1206 Greendale Ave Unit 217
- 1206 Greendale Ave Unit 201
- 100 Bradford St
Your Personal Tour Guide
Ask me questions while you tour the home.