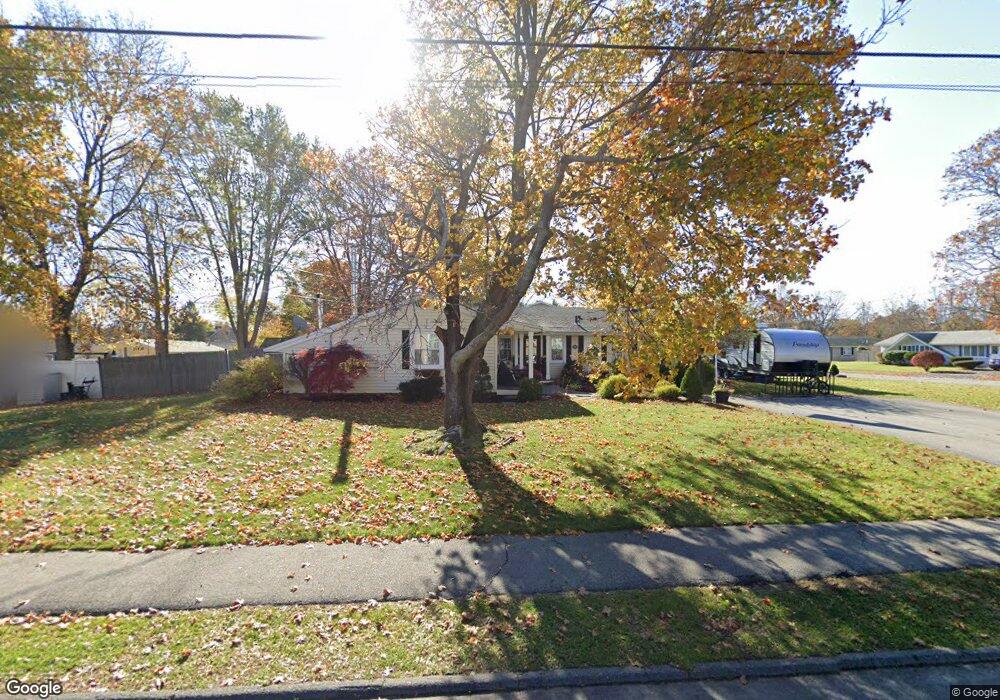
53 Cabot Rd Danvers, MA 01923
Estimated Value: $667,022 - $716,000
3
Beds
2
Baths
1,656
Sq Ft
$417/Sq Ft
Est. Value
About This Home
This home is located at 53 Cabot Rd, Danvers, MA 01923 and is currently estimated at $689,756, approximately $416 per square foot. 53 Cabot Rd is a home located in Essex County with nearby schools including Danvers High School, St. Mary of the Annunciation School, and St. John's Prep.
Ownership History
Date
Name
Owned For
Owner Type
Purchase Details
Closed on
Jun 14, 2006
Sold by
Napoli Colleen and Napoli Giuseppe
Bought by
Coyne Kevin D and Coyne Natasha R
Current Estimated Value
Purchase Details
Closed on
Mar 31, 2000
Sold by
Rich Stephen F and Rich Paula A
Bought by
Napoli Giuseppe and Napoli Colleen
Purchase Details
Closed on
Jun 2, 1995
Sold by
Brown Leonard C and Brown Linda M
Bought by
Dsrich Stephen F and Rich Pauala A
Create a Home Valuation Report for This Property
The Home Valuation Report is an in-depth analysis detailing your home's value as well as a comparison with similar homes in the area
Home Values in the Area
Average Home Value in this Area
Purchase History
| Date | Buyer | Sale Price | Title Company |
|---|---|---|---|
| Coyne Kevin D | $365,000 | -- | |
| Napoli Giuseppe | $187,500 | -- | |
| Dsrich Stephen F | $158,900 | -- |
Source: Public Records
Mortgage History
| Date | Status | Borrower | Loan Amount |
|---|---|---|---|
| Open | Dsrich Stephen F | $324,000 | |
| Closed | Dsrich Stephen F | $324,000 |
Source: Public Records
Tax History
| Year | Tax Paid | Tax Assessment Tax Assessment Total Assessment is a certain percentage of the fair market value that is determined by local assessors to be the total taxable value of land and additions on the property. | Land | Improvement |
|---|---|---|---|---|
| 2025 | $6,559 | $596,800 | $376,400 | $220,400 |
| 2024 | $6,568 | $591,200 | $376,400 | $214,800 |
| 2023 | $6,287 | $535,100 | $342,100 | $193,000 |
| 2022 | $6,148 | $485,600 | $310,400 | $175,200 |
| 2021 | $5,891 | $441,300 | $294,000 | $147,300 |
| 2020 | $5,719 | $437,900 | $290,600 | $147,300 |
| 2019 | $5,463 | $411,400 | $264,100 | $147,300 |
| 2018 | $5,304 | $391,700 | $261,500 | $130,200 |
| 2017 | $5,063 | $356,800 | $228,500 | $128,300 |
| 2016 | $4,827 | $339,900 | $217,900 | $122,000 |
| 2015 | $4,595 | $308,200 | $198,100 | $110,100 |
Source: Public Records
Map
Nearby Homes
- 12 Exeter St
- 6 Colby Rd
- 55 Burley St
- 35 Locust St Unit 3
- 4 Butler Ave
- 4 Chatham Ln
- 78 North St
- 22 Maple Ave
- 6 Venice St Unit B3
- 35 High St Unit 3D
- 6 Laurine Rd
- 14 Williams St Unit C17
- 11 Spring St
- 7 Riverbank Ave Unit 7
- 7 Riverbank Ave
- 11 Riverside Ave Unit 111
- 35 Bayview Terrace Unit 7
- 34 Bayview Terrace Unit 5
- 39 Trask St
- 2 Iroquois Rd
Your Personal Tour Guide
Ask me questions while you tour the home.