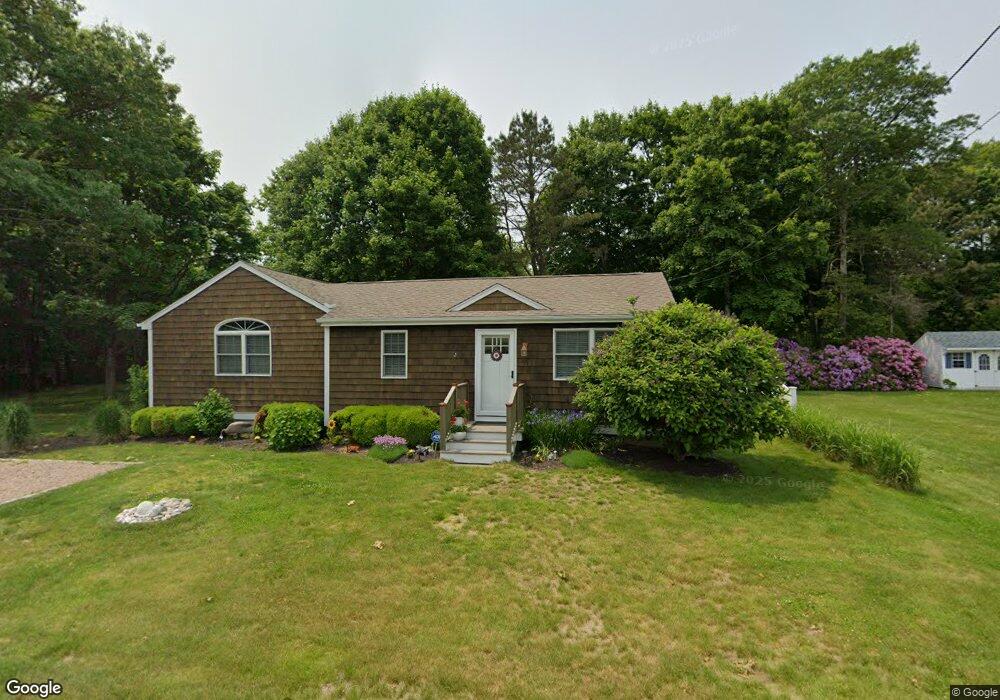
53 Cedar Rd Charlestown, RI 02813
Estimated Value: $670,022 - $823,000
3
Beds
2
Baths
1,160
Sq Ft
$643/Sq Ft
Est. Value
About This Home
This home is located at 53 Cedar Rd, Charlestown, RI 02813 and is currently estimated at $745,506, approximately $642 per square foot. 53 Cedar Rd is a home located in Washington County with nearby schools including Chariho Regional Middle School and Chariho High School.
Ownership History
Date
Name
Owned For
Owner Type
Purchase Details
Closed on
Dec 8, 2006
Sold by
Calabrese David A and Calabrese Andrea M
Bought by
Laskowski Raymond T and Laskowski Ellen F
Current Estimated Value
Home Financials for this Owner
Home Financials are based on the most recent Mortgage that was taken out on this home.
Original Mortgage
$337,500
Interest Rate
6.4%
Mortgage Type
Purchase Money Mortgage
Purchase Details
Closed on
May 18, 1999
Sold by
Tryon Carolyn M
Bought by
Calabrese David A and Calabrese Andrea M
Create a Home Valuation Report for This Property
The Home Valuation Report is an in-depth analysis detailing your home's value as well as a comparison with similar homes in the area
Home Values in the Area
Average Home Value in this Area
Purchase History
| Date | Buyer | Sale Price | Title Company |
|---|---|---|---|
| Laskowski Raymond T | $375,000 | -- | |
| Calabrese David A | $97,500 | -- |
Source: Public Records
Mortgage History
| Date | Status | Borrower | Loan Amount |
|---|---|---|---|
| Open | Calabrese David A | $280,000 | |
| Closed | Calabrese David A | $337,500 | |
| Previous Owner | Calabrese David A | $69,500 | |
| Previous Owner | Calabrese David A | $75,000 |
Source: Public Records
Tax History Compared to Growth
Tax History
| Year | Tax Paid | Tax Assessment Tax Assessment Total Assessment is a certain percentage of the fair market value that is determined by local assessors to be the total taxable value of land and additions on the property. | Land | Improvement |
|---|---|---|---|---|
| 2025 | $3,168 | $534,200 | $323,700 | $210,500 |
| 2024 | $3,088 | $534,200 | $323,700 | $210,500 |
| 2023 | $3,066 | $534,200 | $323,700 | $210,500 |
| 2022 | $2,886 | $353,300 | $185,000 | $168,300 |
| 2021 | $2,890 | $353,300 | $185,000 | $168,300 |
| 2020 | $2,908 | $353,300 | $185,000 | $168,300 |
| 2019 | $2,873 | $311,300 | $185,000 | $126,300 |
| 2018 | $3,001 | $311,300 | $185,000 | $126,300 |
| 2017 | $2,934 | $305,900 | $185,000 | $120,900 |
| 2016 | $3,046 | $298,300 | $172,400 | $125,900 |
| 2015 | $3,016 | $298,300 | $172,400 | $125,900 |
| 2014 | $2,953 | $298,300 | $172,400 | $125,900 |
Source: Public Records
Map
Nearby Homes
- 63 Aspen Rd
- 14 Charlestown Rd
- 15 Charlestown Rd
- 19 Traymore St
- 15 Josephine Dr
- 21 Browning Dr
- 40 Alder Rd
- 350 Narrow Ln
- 10 Josephine Dr Unit 2D
- 108 Balsam Rd
- 130 S Niantic Dr
- 130 Pequot Dr
- 0 Falcone Ln
- 16 Center St
- 154 Alder Rd
- 14 Lakeside Dr
- 45 Elizabeth Cooper Dr
- 0 Old Post Rd
- 107 Wild Goose Rd
- 23 Mohawk Trail