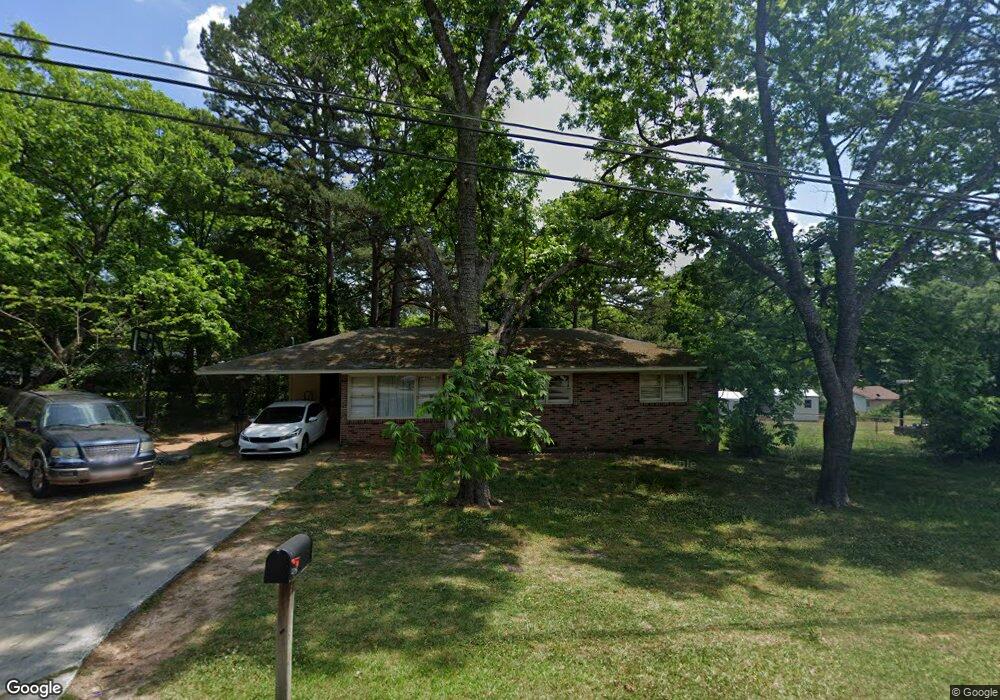
53 Cherry St Toccoa, GA 30577
Estimated Value: $161,000 - $179,000
3
Beds
1
Bath
1,050
Sq Ft
$162/Sq Ft
Est. Value
About This Home
This home is located at 53 Cherry St, Toccoa, GA 30577 and is currently estimated at $170,028, approximately $161 per square foot. 53 Cherry St is a home located in Stephens County with nearby schools including Stephens County High School.
Ownership History
Date
Name
Owned For
Owner Type
Purchase Details
Closed on
Jul 19, 2023
Sold by
Yong Ly Properties Llc
Bought by
Tukes Gwendolyne and Tukes Angela
Current Estimated Value
Home Financials for this Owner
Home Financials are based on the most recent Mortgage that was taken out on this home.
Original Mortgage
$144,500
Outstanding Balance
$83,011
Interest Rate
6.67%
Mortgage Type
New Conventional
Estimated Equity
$87,017
Purchase Details
Closed on
Jul 19, 2018
Sold by
Marion Dooley J
Bought by
Yong Ly Properties Llc
Home Financials for this Owner
Home Financials are based on the most recent Mortgage that was taken out on this home.
Original Mortgage
$80,000
Interest Rate
4.5%
Mortgage Type
Mortgage Modification
Purchase Details
Closed on
Jan 21, 2003
Bought by
<Buyer Info Not Present>
Purchase Details
Closed on
Aug 23, 2001
Bought by
Dooley J Marion
Create a Home Valuation Report for This Property
The Home Valuation Report is an in-depth analysis detailing your home's value as well as a comparison with similar homes in the area
Purchase History
| Date | Buyer | Sale Price | Title Company |
|---|---|---|---|
| Tukes Gwendolyne | $144,500 | -- | |
| Yong Ly Properties Llc | $100,000 | -- | |
| <Buyer Info Not Present> | $43,000 | -- | |
| Dooley J Marion | -- | -- |
Source: Public Records
Mortgage History
| Date | Status | Borrower | Loan Amount |
|---|---|---|---|
| Open | Tukes Gwendolyne | $144,500 | |
| Previous Owner | Yong Ly Properties Llc | $80,000 |
Source: Public Records
Tax History
| Year | Tax Paid | Tax Assessment Tax Assessment Total Assessment is a certain percentage of the fair market value that is determined by local assessors to be the total taxable value of land and additions on the property. | Land | Improvement |
|---|---|---|---|---|
| 2025 | $1,553 | $52,305 | $2,288 | $50,017 |
| 2024 | $1,206 | $33,834 | $2,288 | $31,546 |
| 2023 | $830 | $23,455 | $2,288 | $21,167 |
| 2022 | $660 | $22,184 | $2,288 | $19,896 |
| 2021 | $619 | $19,780 | $2,288 | $17,492 |
| 2020 | $643 | $20,360 | $2,288 | $18,072 |
| 2019 | $646 | $20,360 | $2,288 | $18,072 |
| 2018 | $646 | $20,360 | $2,288 | $18,072 |
| 2017 | $656 | $20,360 | $2,288 | $18,072 |
| 2016 | $646 | $20,359 | $2,287 | $18,072 |
| 2015 | $680 | $20,485 | $2,287 | $18,198 |
| 2014 | $692 | $20,486 | $2,288 | $18,198 |
| 2013 | -- | $20,647 | $2,287 | $18,360 |
Source: Public Records
Map
Nearby Homes
- 926 Skyline Dr
- 372 Hilltop Way
- 820 Collier Rd
- 0 Stephen Dr Unit 10662201
- 475 Hilltop Way
- 0 Valley Dr Unit 7675761
- 0 Valley Dr Unit 10600268
- 43 Sycamore Dr
- 526 Poplar St
- 229 Hilltop Ln
- 189 Julia Ln
- 122 King St
- 27 Hilltop Ln
- 9 Poplar St
- 321 Quail Forest Cir
- 59 Sunset Ln
- 146 Collier Rd
- 104-110 White Pine Rd
- 30 Moore Ave
- 0 Hwy 17 Alt Unit 10577119
Your Personal Tour Guide
Ask me questions while you tour the home.