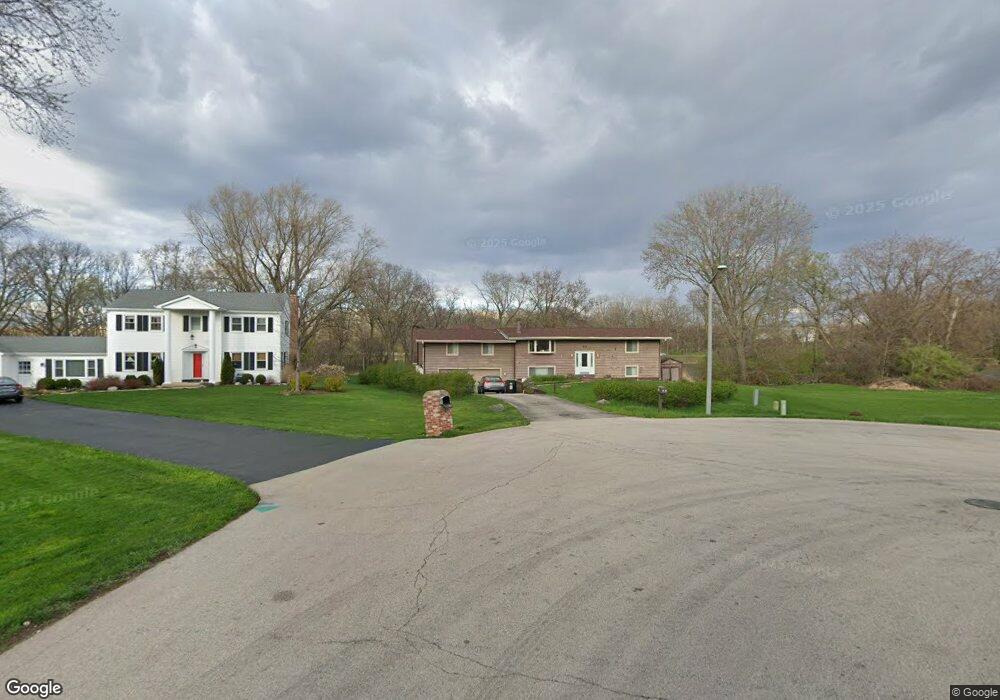
53 E Anchor Dr Oswego, IL 60543
Northwest Oswego NeighborhoodEstimated Value: $393,337 - $469,000
Studio
--
Bath
2,031
Sq Ft
$218/Sq Ft
Est. Value
About This Home
This home is located at 53 E Anchor Dr, Oswego, IL 60543 and is currently estimated at $442,584, approximately $217 per square foot. 53 E Anchor Dr is a home located in Kendall County with nearby schools including Fox Chase Elementary School, Traughber Junior High School, and Oswego High School.
Ownership History
Date
Name
Owned For
Owner Type
Purchase Details
Closed on
Mar 16, 2006
Sold by
Musser Roger W and Musser Gayle M
Bought by
Harrison Steven and Harrison Jennifer
Current Estimated Value
Home Financials for this Owner
Home Financials are based on the most recent Mortgage that was taken out on this home.
Original Mortgage
$300,000
Outstanding Balance
$167,673
Interest Rate
6.37%
Mortgage Type
Fannie Mae Freddie Mac
Estimated Equity
$274,911
Purchase Details
Closed on
Nov 5, 2002
Sold by
Musser Roger W and Musser Gayle M
Bought by
Musser Roger W and Musser Gayle M
Home Financials for this Owner
Home Financials are based on the most recent Mortgage that was taken out on this home.
Original Mortgage
$149,000
Interest Rate
6.1%
Purchase Details
Closed on
Apr 1, 1992
Bought by
Musser Roger W and Musser Gayle M
Purchase Details
Closed on
Jul 1, 1991
Bought by
Merchants Natl Bk Tr 4450
Purchase Details
Closed on
Dec 1, 1987
Purchase Details
Closed on
Jun 1, 1986
Create a Home Valuation Report for This Property
The Home Valuation Report is an in-depth analysis detailing your home's value as well as a comparison with similar homes in the area
Home Values in the Area
Average Home Value in this Area
Purchase History
| Date | Buyer | Sale Price | Title Company |
|---|---|---|---|
| Harrison Steven | $385,000 | Ticor Title | |
| Musser Roger W | -- | Chicago Title Insurance Co | |
| Musser Roger W | $150,000 | -- | |
| Merchants Natl Bk Tr 4450 | $144,300 | -- | |
| -- | $105,000 | -- | |
| -- | $68,000 | -- |
Source: Public Records
Mortgage History
| Date | Status | Borrower | Loan Amount |
|---|---|---|---|
| Open | Harrison Steven | $300,000 | |
| Previous Owner | Musser Roger W | $149,000 | |
| Closed | Merchants Natl Bk Tr 4450 | -- |
Source: Public Records
Tax History
| Year | Tax Paid | Tax Assessment Tax Assessment Total Assessment is a certain percentage of the fair market value that is determined by local assessors to be the total taxable value of land and additions on the property. | Land | Improvement |
|---|---|---|---|---|
| 2024 | $10,183 | $134,642 | $32,985 | $101,657 |
| 2023 | $9,264 | $120,216 | $29,451 | $90,765 |
| 2022 | $9,264 | $110,290 | $27,019 | $83,271 |
| 2021 | $8,937 | $103,074 | $25,251 | $77,823 |
| 2020 | $9,322 | $106,262 | $26,032 | $80,230 |
| 2019 | $9,111 | $102,442 | $26,032 | $76,410 |
| 2018 | $8,159 | $89,586 | $22,765 | $66,821 |
| 2017 | $8,092 | $86,140 | $21,889 | $64,251 |
| 2016 | $7,752 | $81,649 | $20,748 | $60,901 |
| 2015 | $7,638 | $77,028 | $19,574 | $57,454 |
| 2014 | -- | $74,065 | $18,821 | $55,244 |
| 2013 | -- | $74,813 | $19,011 | $55,802 |
Source: Public Records
Map
Nearby Homes
- 6 E Anchor Dr
- 5.43 B-3 Commercial State Route 31
- 7.43 Acres Vacant La State Route 31
- 115 Harbor Dr
- 2400 Light Rd Unit 207
- 2300 Light Rd Unit 202
- 119 Garden Dr
- 22 Guilford Rd
- 9 Cebold Dr
- 1415 State Route 31
- 117 Boulder Hill Pass Unit 117
- 104 Augusta Rd
- 116 River Mist Dr
- 28 Seneca Dr
- 133 River Mist Dr Unit 3
- 135 River Mist Dr Unit 2
- 20 Durango Rd
- 130 Fox Chase Dr S
- 2110 State Route 31
- 123 Fox Chase Dr S
- 49 E Anchor Dr
- 6 Marina Dr
- 45 E Anchor Dr
- 41 E Anchor Dr
- 10 Marina Dr
- 40 E Anchor Dr
- 35 E Anchor Dr
- 14 Marina Dr
- 11 Marina Dr
- 34 E Anchor Dr
- 15 Marina Dr
- 18 Marina Dr
- 31 E Anchor Dr
- 30 E Anchor Dr
- Parcel 004 & 003 Illinois 25
- 37 Boat Ln
- 27 E Anchor Dr
- 31 Boat Ln
- 24 Marina Dr
- Parcel 003 & 004 Illinois 25
Your Personal Tour Guide
Ask me questions while you tour the home.