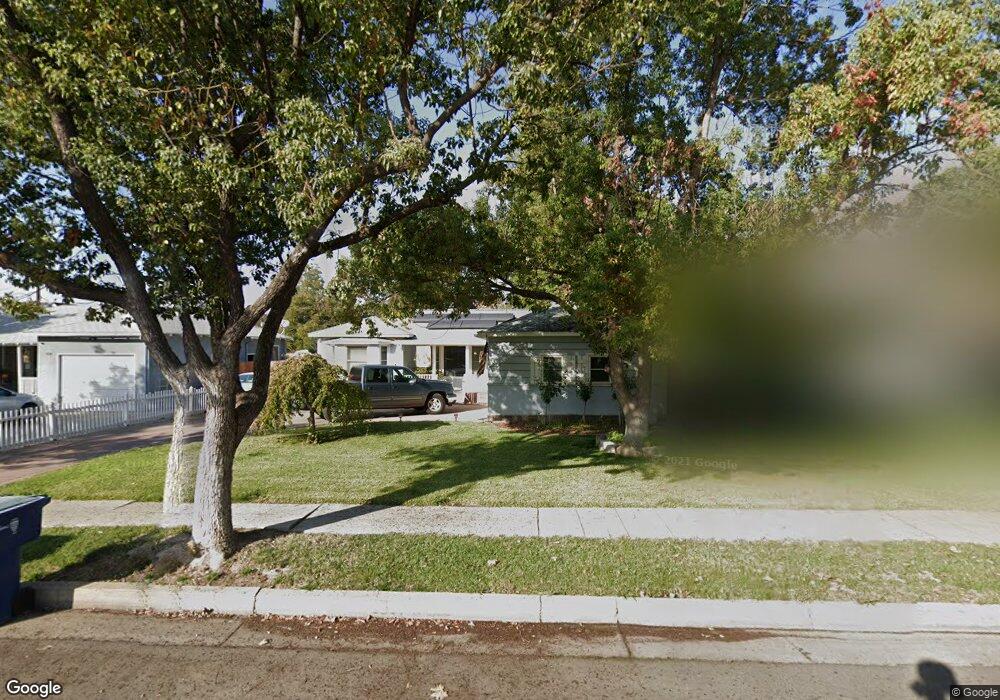
53 E Andrews Ave Fresno, CA 93704
Maroa NeighborhoodEstimated Value: $289,293 - $327,000
2
Beds
2
Baths
1,101
Sq Ft
$279/Sq Ft
Est. Value
About This Home
This home is located at 53 E Andrews Ave, Fresno, CA 93704 and is currently estimated at $307,073, approximately $278 per square foot. 53 E Andrews Ave is a home located in Fresno County with nearby schools including Hamilton School, Fresno High School, and Morris E. Dailey Charter Elementary School.
Ownership History
Date
Name
Owned For
Owner Type
Purchase Details
Closed on
Nov 6, 2021
Sold by
Wolfe Kurt M
Bought by
Wolfe Kurt M and Wolfe Laura M
Current Estimated Value
Purchase Details
Closed on
Jul 13, 2004
Sold by
Wolfe Kurt M and Hooper Wolfe Robin Sue
Bought by
Wolfe Kurt M and Hooper Wolfe Robin
Home Financials for this Owner
Home Financials are based on the most recent Mortgage that was taken out on this home.
Original Mortgage
$67,000
Interest Rate
6.27%
Mortgage Type
Purchase Money Mortgage
Purchase Details
Closed on
Jun 23, 2004
Sold by
Va
Bought by
Wolfe Kurt M and Hooper Wolfe Robin Sue
Home Financials for this Owner
Home Financials are based on the most recent Mortgage that was taken out on this home.
Original Mortgage
$67,000
Interest Rate
6.27%
Mortgage Type
Purchase Money Mortgage
Create a Home Valuation Report for This Property
The Home Valuation Report is an in-depth analysis detailing your home's value as well as a comparison with similar homes in the area
Home Values in the Area
Average Home Value in this Area
Purchase History
| Date | Buyer | Sale Price | Title Company |
|---|---|---|---|
| Wolfe Kurt M | -- | Accommodation | |
| Wolfe Kurt M | -- | North American Title Co Inc | |
| Wolfe Kurt M | -- | North American Title Co Inc |
Source: Public Records
Mortgage History
| Date | Status | Borrower | Loan Amount |
|---|---|---|---|
| Closed | Wolfe Kurt M | $67,000 |
Source: Public Records
Tax History Compared to Growth
Tax History
| Year | Tax Paid | Tax Assessment Tax Assessment Total Assessment is a certain percentage of the fair market value that is determined by local assessors to be the total taxable value of land and additions on the property. | Land | Improvement |
|---|---|---|---|---|
| 2025 | $1,483 | $123,819 | $33,757 | $90,062 |
| 2023 | $1,483 | $119,014 | $32,448 | $86,566 |
| 2022 | $1,432 | $116,681 | $31,812 | $84,869 |
| 2021 | $1,391 | $114,394 | $31,189 | $83,205 |
| 2020 | $1,385 | $113,222 | $30,870 | $82,352 |
| 2019 | $1,330 | $111,003 | $30,265 | $80,738 |
| 2018 | $1,300 | $108,827 | $29,672 | $79,155 |
| 2017 | $1,276 | $106,694 | $29,091 | $77,603 |
| 2016 | $1,233 | $104,603 | $28,521 | $76,082 |
| 2015 | $1,214 | $103,033 | $28,093 | $74,940 |
| 2014 | $1,187 | $101,016 | $27,543 | $73,473 |
Source: Public Records
Map
Nearby Homes
- 36 E Cortland Ave
- 32 E Fedora Ave
- 2925 N Farris Ave
- 311 E Dayton Ave
- 345 W Dayton Ave
- 145 W Robinson Ave
- 2649 N Adoline Ave
- 545 W Fedora Ave
- 3725 N Fruit Ave Unit B
- A N Fruit Ave
- 3749 N Fruit Ave Unit A
- B N Fruit Ave
- 3723 N Van Ness Blvd
- 3125 N Pacific Ave
- 130 E Terrace Ave
- 204 E Terrace Ave
- 804 W Michigan Ave
- 2839 N Delno Ave
- 506 W Terrace Ave
- 3932 N Safford Ave
- 43 E Andrews Ave
- 63 E Andrews Ave
- 33 E Andrews Ave
- 73 E Andrews Ave
- 54 E Fountain Way
- 44 E Fountain Way
- 64 E Fountain Way
- 23 E Andrews Ave
- 83 E Andrews Ave
- 52 E Andrews Ave
- 34 E Fountain Way
- 62 E Andrews Ave
- 44 E Andrews Ave
- 74 E Andrews Ave
- 24 E Fountain Way
- 82 E Fountain Way
- 13 E Andrews Ave
- 93 E Andrews Ave
- 84 E Andrews Ave
- 24 E Andrews Ave