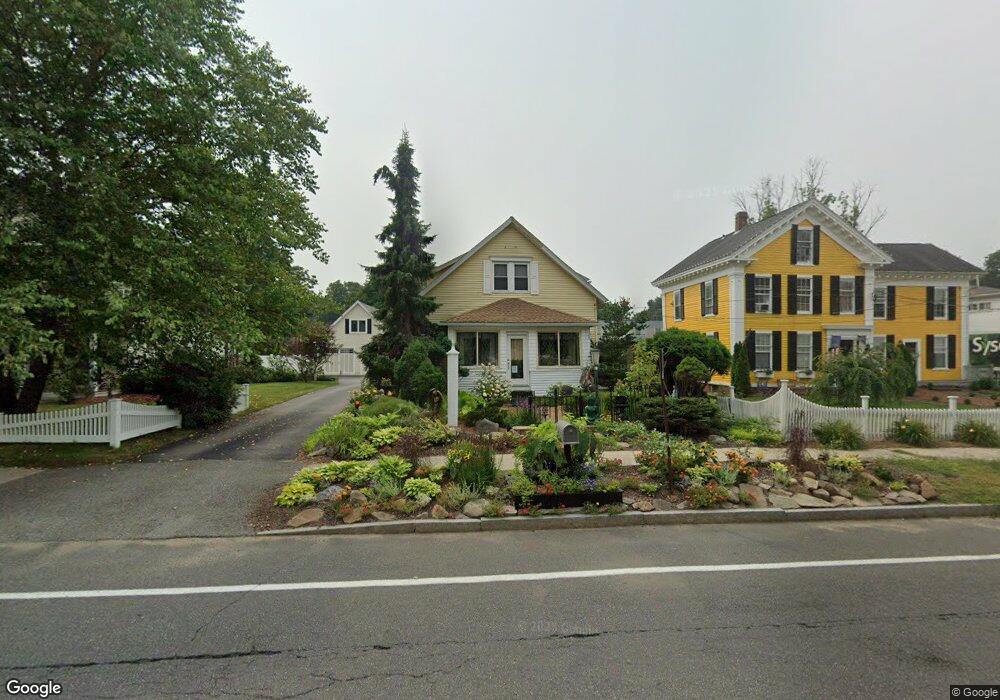
53 E Main St West Brookfield, MA 01585
Estimated Value: $401,637
3
Beds
2
Baths
1,857
Sq Ft
$216/Sq Ft
Est. Value
About This Home
This home is located at 53 E Main St, West Brookfield, MA 01585 and is currently estimated at $401,637, approximately $216 per square foot. 53 E Main St is a home located in Worcester County with nearby schools including Quaboag Regional High School.
Ownership History
Date
Name
Owned For
Owner Type
Purchase Details
Closed on
Nov 19, 2021
Sold by
Moore Kevin D
Bought by
Moore Kevin D and Sampieri Mark E
Current Estimated Value
Purchase Details
Closed on
Apr 4, 2005
Sold by
Merrick Harold A and Chouinard Keith J
Bought by
Moore Kevin D
Home Financials for this Owner
Home Financials are based on the most recent Mortgage that was taken out on this home.
Original Mortgage
$175,000
Interest Rate
5.61%
Mortgage Type
Commercial
Create a Home Valuation Report for This Property
The Home Valuation Report is an in-depth analysis detailing your home's value as well as a comparison with similar homes in the area
Home Values in the Area
Average Home Value in this Area
Purchase History
| Date | Buyer | Sale Price | Title Company |
|---|---|---|---|
| Moore Kevin D | -- | None Available | |
| Moore Kevin D | $220,000 | -- |
Source: Public Records
Mortgage History
| Date | Status | Borrower | Loan Amount |
|---|---|---|---|
| Previous Owner | Moore Kevin D | $175,000 |
Source: Public Records
Tax History
| Year | Tax Paid | Tax Assessment Tax Assessment Total Assessment is a certain percentage of the fair market value that is determined by local assessors to be the total taxable value of land and additions on the property. | Land | Improvement |
|---|---|---|---|---|
| 2025 | $3,945 | $366,000 | $51,600 | $314,400 |
| 2024 | $4,110 | $366,000 | $51,600 | $314,400 |
| 2023 | $3,988 | $332,600 | $46,900 | $285,700 |
| 2022 | $3,778 | $285,600 | $44,700 | $240,900 |
| 2021 | $3,655 | $260,500 | $44,700 | $215,800 |
| 2020 | $3,118 | $212,100 | $44,700 | $167,400 |
| 2019 | $3,324 | $212,100 | $44,700 | $167,400 |
| 2018 | $3,293 | $204,900 | $44,700 | $160,200 |
| 2017 | $2,920 | $181,800 | $45,100 | $136,700 |
| 2016 | $2,820 | $181,800 | $45,100 | $136,700 |
| 2015 | $2,723 | $181,800 | $45,100 | $136,700 |
Source: Public Records
Map
Nearby Homes
- 37 Central St
- 91 W Main St
- 3 Foster Rd
- 25 Highland Trail
- 21 Beach Dr
- 291 Wigwam Rd
- 940 Old West Brookfield Rd
- 18-20 Old w Brookfield Rd
- 10 Green St
- 28 Long Hill Rd
- 46 Madden Rd Unit 38
- 49 Smith Hanson Rd
- 260 Wickaboag Valley Rd
- 61 Bates St
- 29 Kimball St
- 10 Brookfield Rd
- 65 Pierce Rd
- 8 Nanatomqua Dr Unit N55
- 18 Tyler St
- 6 2nd St
Your Personal Tour Guide
Ask me questions while you tour the home.