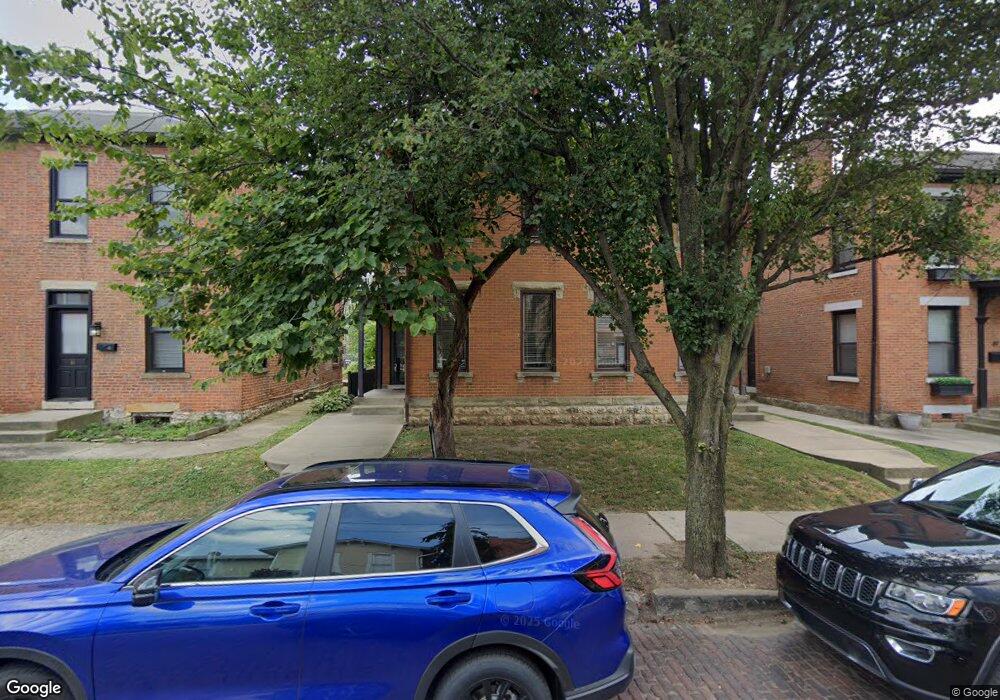
53 E Russell St Unit 7 Columbus, OH 43215
Italian Village NeighborhoodEstimated Value: $617,000 - $954,641
3
Beds
2
Baths
1,783
Sq Ft
$450/Sq Ft
Est. Value
About This Home
This home is located at 53 E Russell St Unit 7, Columbus, OH 43215 and is currently estimated at $801,660, approximately $449 per square foot. 53 E Russell St Unit 7 is a home located in Franklin County with nearby schools including Hubbard Elementary School, Dominion Middle School, and Whetstone High School.
Ownership History
Date
Name
Owned For
Owner Type
Purchase Details
Closed on
Sep 25, 2023
Sold by
53-57 E Russell Llc
Bought by
Summit Street Holdings Llc
Current Estimated Value
Home Financials for this Owner
Home Financials are based on the most recent Mortgage that was taken out on this home.
Original Mortgage
$510,107
Outstanding Balance
$498,343
Interest Rate
7.19%
Estimated Equity
$303,317
Purchase Details
Closed on
Mar 14, 2019
Sold by
Northwood Properties Inc
Bought by
53 57 E Russell Llc
Purchase Details
Closed on
Jun 10, 2015
Sold by
Skinner Glenn
Bought by
Northwood Properties Inc
Home Financials for this Owner
Home Financials are based on the most recent Mortgage that was taken out on this home.
Original Mortgage
$450,000
Interest Rate
3.82%
Mortgage Type
New Conventional
Purchase Details
Closed on
Aug 31, 1977
Bought by
Skinner Ii Glenn
Create a Home Valuation Report for This Property
The Home Valuation Report is an in-depth analysis detailing your home's value as well as a comparison with similar homes in the area
Home Values in the Area
Average Home Value in this Area
Purchase History
| Date | Buyer | Sale Price | Title Company |
|---|---|---|---|
| Summit Street Holdings Llc | $707,500 | Ohio Real Title | |
| 53 57 E Russell Llc | -- | Amerititle | |
| Northwood Properties Inc | $400,000 | Valmer Land Title Agency Box | |
| Skinner Ii Glenn | -- | -- |
Source: Public Records
Mortgage History
| Date | Status | Borrower | Loan Amount |
|---|---|---|---|
| Open | Summit Street Holdings Llc | $510,107 | |
| Previous Owner | Northwood Properties Inc | $450,000 |
Source: Public Records
Tax History
| Year | Tax Paid | Tax Assessment Tax Assessment Total Assessment is a certain percentage of the fair market value that is determined by local assessors to be the total taxable value of land and additions on the property. | Land | Improvement |
|---|---|---|---|---|
| 2025 | $14,078 | $229,270 | $75,260 | $154,010 |
| 2024 | $14,078 | $229,270 | $75,260 | $154,010 |
| 2023 | $9,989 | $220,730 | $75,260 | $145,470 |
| 2022 | $10,255 | $192,970 | $33,080 | $159,890 |
| 2021 | $10,273 | $192,970 | $33,080 | $159,890 |
| 2020 | $10,289 | $192,970 | $33,080 | $159,890 |
| 2019 | $8,889 | $142,960 | $24,510 | $118,450 |
| 2018 | $8,729 | $142,960 | $24,510 | $118,450 |
| 2017 | $8,888 | $142,960 | $24,510 | $118,450 |
| 2016 | $9,429 | $138,790 | $22,690 | $116,100 |
| 2015 | $8,584 | $138,790 | $22,690 | $116,100 |
| 2014 | $8,605 | $138,790 | $22,690 | $116,100 |
| 2013 | -- | $91,000 | $16,625 | $74,375 |
Source: Public Records
Map
Nearby Homes
- 89 E Lincoln St
- 674 Park St
- 50 W Russell St
- 36 W Russell St
- 704 Park St
- 53 Buttles Ave
- 769 N High St Unit 303
- 66 E Hubbard Ave
- 58 E Hubbard Ave Unit C
- 53 E Prescott St
- 845 N High St Unit 407
- 845 N High St Unit 404
- 845 N High St Unit 501 & 502
- 835 Summit St
- 130 Buttles Ave
- 846 Summit St
- 751 N 6th St Unit 205
- 230 Neruda Ave
- 270 Dickenson St Unit 303
- 270 Dickenson St Unit 402
- 53 E Russell St Unit 57
- 57 E Russell St
- 49 E Russell St Unit 49
- 47 E Russell St Unit 4749
- 59 E Russell St Unit ID1265648P
- 61 E Russell St Unit ID1265621P
- 59-63 E Russell St Unit ID1265621P
- 59-63 E Russell St Unit ID1265613P
- 59-63 E Russell St Unit ID1265648P
- 59-63 E Russell St Unit ID1265612P
- 61 E Russell St Unit ID1265612P
- 61-63 E Russell St Unit ID1265621P
- 41 E Russell St
- 41-43 E Russell St
- 63 E Russell St Unit ID1265613P
- 63 E Russell St
- 39 E Russell St Unit 39
- 37 E Russell St Unit A
- 58 E Russell St Unit 60
- 56 E Russell St Unit 56
Your Personal Tour Guide
Ask me questions while you tour the home.