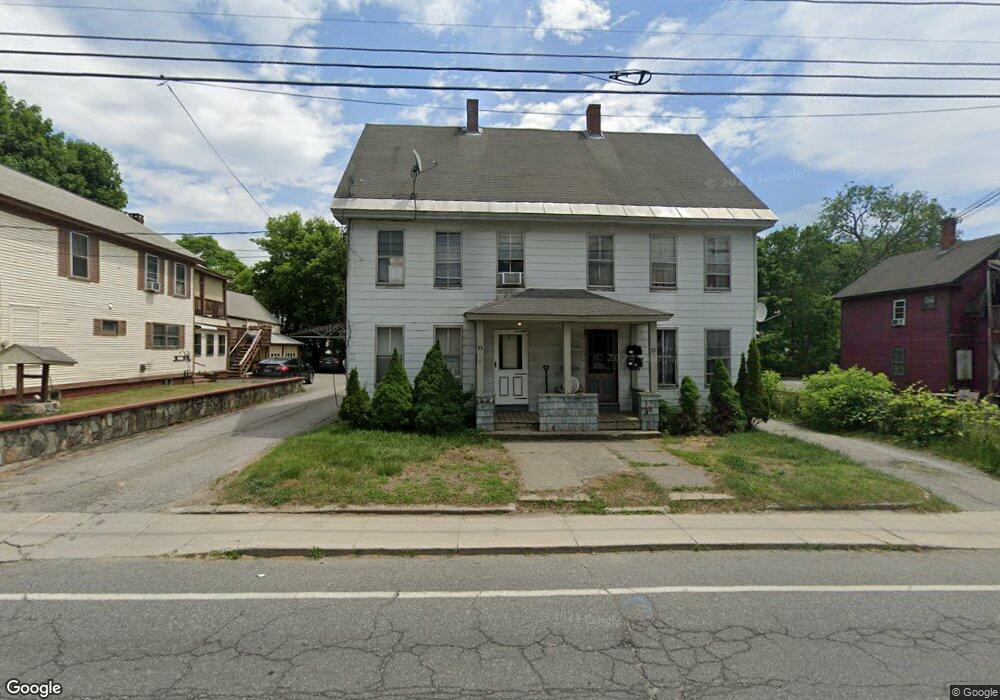
53 Elm St Unit 55 Claremont, NH 03743
North End NeighborhoodEstimated Value: $188,000 - $353,000
9
Beds
3
Baths
4,430
Sq Ft
$59/Sq Ft
Est. Value
About This Home
This home is located at 53 Elm St Unit 55, Claremont, NH 03743 and is currently estimated at $259,405, approximately $58 per square foot. 53 Elm St Unit 55 is a home located in Sullivan County with nearby schools including Disnard Elementary School, Claremont Middle School, and Stevens High School.
Ownership History
Date
Name
Owned For
Owner Type
Purchase Details
Closed on
Dec 29, 2023
Sold by
53-55 Elm St Llc
Bought by
Torsey Amelia R and Torsey Kenneth S
Current Estimated Value
Home Financials for this Owner
Home Financials are based on the most recent Mortgage that was taken out on this home.
Original Mortgage
$146,250
Outstanding Balance
$143,669
Interest Rate
7.44%
Mortgage Type
Purchase Money Mortgage
Estimated Equity
$115,736
Purchase Details
Closed on
Aug 26, 2005
Sold by
Tung Shing
Bought by
Braginetz Thomas J and Braginetz Elizabeth J
Home Financials for this Owner
Home Financials are based on the most recent Mortgage that was taken out on this home.
Original Mortgage
$93,000
Interest Rate
5.68%
Mortgage Type
Purchase Money Mortgage
Create a Home Valuation Report for This Property
The Home Valuation Report is an in-depth analysis detailing your home's value as well as a comparison with similar homes in the area
Home Values in the Area
Average Home Value in this Area
Purchase History
| Date | Buyer | Sale Price | Title Company |
|---|---|---|---|
| Torsey Amelia R | $195,000 | None Available | |
| Braginetz Thomas J | $124,000 | -- |
Source: Public Records
Mortgage History
| Date | Status | Borrower | Loan Amount |
|---|---|---|---|
| Open | Torsey Amelia R | $146,250 | |
| Previous Owner | Braginetz Thomas J | $93,000 |
Source: Public Records
Tax History Compared to Growth
Tax History
| Year | Tax Paid | Tax Assessment Tax Assessment Total Assessment is a certain percentage of the fair market value that is determined by local assessors to be the total taxable value of land and additions on the property. | Land | Improvement |
|---|---|---|---|---|
| 2024 | $6,142 | $209,900 | $33,300 | $176,600 |
| 2023 | $5,835 | $209,900 | $33,300 | $176,600 |
| 2022 | $4,864 | $116,700 | $15,300 | $101,400 |
| 2021 | $4,782 | $116,700 | $15,300 | $101,400 |
| 2020 | $4,752 | $116,700 | $15,300 | $101,400 |
| 2019 | $4,739 | $117,700 | $15,300 | $102,400 |
| 2018 | $2,599 | $119,900 | $15,300 | $104,600 |
| 2017 | $2,597 | $119,900 | $15,300 | $104,600 |
| 2016 | $5,110 | $119,900 | $15,300 | $104,600 |
| 2015 | $4,972 | $119,900 | $15,300 | $104,600 |
| 2014 | $4,955 | $119,900 | $15,300 | $104,600 |
| 2013 | $4,966 | $137,000 | $16,300 | $120,700 |
Source: Public Records
Map
Nearby Homes